

[Student IDEAS] by Hugo Jalet - Graduate of the Global BBA at ESSEC Business School
Artificial intelligence is fundamentally altering the statistical nature of cyber risk in finance, shifting it from an isolated, firm-specific operational threat into a correlated, fat-tailed financial variable. By moving attack vectors from network perimeters to training data and foundation models—and with high market concentration across a few cloud and AI providers—AI-driven threats introduce heavy-tailed loss severity, accelerated industry-wide propagation, and extended detection lags where malicious interventions hide as ordinary "model drift." Because existing financial pricing, capital buffers, and board governance remain calibrated to pre-AI historical data, institutions are running an unpriced tail risk that threatens equity financing, liquidity, and balance sheet stability; addressing this requires integrating cyber and AI governance, stress-testing for multi-day operational outages, and sizing capital against third-party concentration.
---
In early 2024, a finance employee at the British engineering firm Arup joined what looked like a routine video call with her chief financial officer (CFO) and several colleagues. By the end of it, she had authorised fifteen transfers totalling roughly $25 million to accounts in Hong Kong. Weeks later, the firm discovered that every participant on the call, CFO included, was a deepfake: a hyper-realistic fake video and voice, generated by artificial intelligence (AI), that impersonates a real person.1 The story made headlines for a few days, then faded. It should not have. By mid-2025, deepfake-enabled fraud alone had driven close to $900 million in reported losses globally, with more than $410 million concentrated in the first half of the year, already exceeding the total for all of 2024.2
The Arup incident is usually told as a story about weak verification protocols and the need for better employee training. That framing is not wrong, but it is far too narrow. Arup lost money on a single wire; the underlying phenomenon is something finance has not yet priced. Artificial intelligence is quietly reshaping what cyber risk looks like as a statistical object. Losses are becoming less idiosyncratic and more correlated, tails are fatter, detection is slower, and propagation across firms is faster, largely because banks, insurers, and asset managers increasingly share the same foundation models, training data, and cloud vendors.
This matters because finance has, for more than a decade, treated cyber as primarily an operational and compliance issue: a cost line, a maturity score, an audit-committee bullet. That mental model was already strained, and in an AI-driven system, it quietly breaks. Cyber resilience is no longer a sidebar; it is a financial variable whose distribution has shifted, and which neither markets nor most institutions have repriced. The practical question for boards, chief risk officers (CROs), and investors is therefore not "how much more should we spend on security?" but "how must we redesign governance, capital planning, and disclosure once the tail of cyber losses has moved?"
To see why the familiar playbook no longer fits, it is worth being precise about what is genuinely new.
The past decade of digital transformation in finance mostly expanded what cyber risk could affect: more systems online, more data in motion, more third parties in the chain. Artificial intelligence does something different. It shifts four properties of the loss distribution itself, and each of these shifts quietly erodes the "perimeter plus patch" mental model (the assumption that security means defending a network boundary with firewalls and access controls, then closing known software flaws with timely patches) that still governs most cyber budgets.
The attack surface moves from code and credentials to data and models. Classical cyber defence is organised around code, infrastructure, and identities: firewalls, segmentation, access controls, patch cycles. An AI system is a different object. It can be compromised by corrupting the training data itself, before a single credential is ever stolen. Yerlikaya and Bahtiyar (2022) show how quickly this matters. They study data poisoning, which means deliberately corrupting part of the training data, the data used to teach and build a model. Across four datasets (spam, botnet, malware, and medical diagnostics) and six standard algorithms, the researchers deliberately altered the correct classifications in a quarter of the training data (labelling spam as legitimate, for instance). This alone cut classification accuracy by 15 to 40 percentage points, and when half of the training data was corrupted, model performance collapsed in several configurations. Transposed to finance, this is a structurally new threat: a well-placed intervention in the training pipeline (the process that collects, prepares, and feeds data into a model while it is being built) of a credit-scoring model, a transaction-monitoring engine, or an algorithmic pricing system does not need to breach the firewall to cause losses.
These threats target two distinct stages in the life of an AI system. At training time, while the model is being built, data poisoning and training-set contamination corrupt what it learns. At inference time, when the trained model is being used to make real decisions, attackers exploit it through prompt injection (hiding malicious instructions in the text or data the model reads) and model manipulation (feeding it carefully crafted inputs, or tampering with the model itself, so that it produces the outputs the attacker wants). Both bypass the controls built for the old perimeter: neither needs to breach a firewall or steal a credential, because the vulnerability lives in the data and the model itself, not at the network boundary. They now sit beside ransomware and phishing on the threat list.
Detection lag lengthens because model failure looks like drift. Traditional cyber incidents are largely binary. A system is down, an account is drained, a file is encrypted. AI failures are probabilistic. A poisoned fraud model does not stop working; it simply scores certain transactions a little more leniently. A manipulated credit model does not crash; it tilts approvals in a subtle direction. These incidents are easily reinterpreted as "model drift", an accepted, almost decorative feature of machine-learning (ML) models in production. The result is that the time between occurrence, discovery, and recognition stretches. Even without AI, the problem is already acute: using cross-country operational-loss data from seventy banks over sixteen years, Aldasoro et al. (2023) document an average lag of more than a year between when an operational loss occurs and when it is finally booked (formally recorded as a loss in the accounts), with a long-tailed distribution in which a meaningful share of events remain unaccounted for after two years. Layer on the probabilistic opacity of AI systems and one should expect that distribution to stretch further, not tighten. For capital and liquidity planning, the implication is unpleasant: by the time a model-level compromise is formally recognised, much of its damage may already have been absorbed into the balance sheet.

Timeline of an operational loss event. Source: Aldasoro et al. (2023). Three dates structure every loss event: occurrence, discovery, and recognition. AI-driven incidents stretch t₁ (occurrence → discovery) because probabilistic failures resemble model drift.
Propagation accelerates through shared models, shared data, and concentrated cloud providers. The novelty is blunt: banks, insurers, and asset managers no longer need to do business with each other to share cyber exposure; they only need to rely on the same foundation model, the same training corpus, or the same hyperscale cloud provider, so a single compromise can reach firms with no direct contractual link. This is a different transmission channel from the one finance is used to.
In the pre-AI cyber world, contagion travelled mainly through explicit economic linkages: interbank exposures, counterparty relationships, payment networks. The pre-mortem analysis of Fedwire by Eisenbach, Kovner and Lee (2022) already showed how powerful that channel alone could be. The impairment of any one of the five largest U.S. banks spills over to an average of 38% of the network. A shock concentrated on a single third-party service provider common to several large institutions does even more damage: it pushes the weighted share of impaired institutions to roughly 60%, with potential forgone payment activity reaching more than 2.5 times daily gross domestic product (GDP) once banks start hoarding liquidity.
That shared layer is no longer hypothetical. In the 2024 survey by the Bank of England and the Financial Conduct Authority (FCA), 75% of UK financial firms reported already using AI, up from 58% two years earlier, though adoption remains uneven: many firms are still standing up data pipelines or running a general-purpose chat assistant for back-office work, while a smaller set already embeds foundation models directly into credit, fraud, and trading decisions. Foundation models account for 17% of all use cases, and a third of use cases now run on third-party implementations (Bank of England and FCA, 2024).
That third-party supply is strikingly concentrated: the three most-cited providers account for 73% of all named cloud providers, 44% of model providers, and 33% of data providers. Concentration on that scale means many institutions are exposed, without any direct link to one another, to the same handful of upstream failures, which is why the same survey ranks cybersecurity as the highest perceived systemic risk and critical third-party dependencies as the fastest-growing one. This is precisely the concern the EU's Digital Operational Resilience Act (DORA) attempts to address through its oversight regime for "critical" third-party information and communication technology (ICT) providers, which formally recognises for the first time that cloud and model concentration is a systemic variable, not a purely commercial one (Kun, 2024).

The figure shows the distribution of the network impact for the scenario with a disruption originating from a third-party service provider. “Share” represents the unweighted percent of institutions that become impaired. “Weighted share” represents the percent of institutions that become impaired, weighted by asset size. “Net weighted share” refers to the percent of institutions that become impaired, net of the shocked institutions.
Loss tails fatten because one compromise now hits many pipelines at once. The combination of the first three shifts has a direct statistical consequence: the severity distribution of cyber losses becomes heavier in the right tail. If a single poisoned dataset or compromised model feeds credit decisioning, fraud scoring, and trading signals across multiple institutions, a single event generates correlated losses across several profit-and-loss (P&L) lines and several firms simultaneously. Aldasoro et al. (2023) already find that although cyber events are still rare relative to other operational losses, cyber risk can account for up to a third of a bank's total operational value-at-risk, with most of that contribution concentrated in the tail. A 2025 panel of chief information security officers (CISOs) and board directors convened by McKinsey and the National Association of Corporate Directors (NACD) captures the shift in blunt terms, with one participant noting that under AI-fuelled threats, the "variability and severity are so drastic" that traditional maturity scores carry little signal (McKinsey & Company, 2025).
Taken together, these four shifts describe a cyber risk that is less idiosyncratic, less binary, more correlated across firms, and slower to surface than the one the industry has built tools for. The governance model inherited from the last decade (a CISO who patches systems, an audit committee that tracks maturity scores, and an insurer who prices firm-level history) was not designed for this object. The question is what happens once this new distribution is properly recognised, first in prices and capital, then in governance and disclosure.
A shift in the cyber loss distribution only matters financially to the extent that it travels into the numbers that boards, creditors, and markets actually look at. And on current evidence, much of that journey has not yet happened.
Inside the firm. The most visible channel is the earnings hit. Operational losses from remediation, incident response, customer notification, legal fees, and regulatory fines feed directly into quarterly results. Using a cross-country panel of roughly seventy large banks over sixteen years, Aldasoro et al. (2023) estimate that operational risk capital varies between 1% and 7.5% of gross income depending on the calibration method used, and that cyber-specific capital can account for up to a third of that total. Franco et al. (2024) argue that even those figures underestimate firm-level exposure for the median institution because they remain rooted in probability-based simulations rather than observed real-world loss data; their Real Cyber Value at Risk (RCVaR) framework is designed precisely to close that gap by estimating costs directly from industry incident reports.
A second channel is the balance sheet. Remediation spending, accelerated information-technology investments, and litigation reserves erode capital buffers over the quarters that follow an incident, which changes how firms finance themselves. Liu, Luo & Yawson (2025), using a U.S. sample running from 2005 to 2019, find that attacked firms become 56% to 61% less likely than matched non-attacked firms to undertake a seasoned equity offering (SEO), that is, a new share issue by an already-listed company, over the three years after the attack, with SEO proceeds dropping in parallel. The mechanism they document is not a shortage of capital need but an excess of capital cost: reputation loss raises the adverse-selection premium that equity investors demand, and firms rationally shrink their equity issuance. The effect also spills over to industry peers who were not themselves attacked, whose SEO probability falls by roughly 18% to 20% of its baseline and whose SEO proceeds decline by about 13.5%, suggesting that markets treat a single cyber event as information about a sector's underlying cyber risk, not just about the target firm.
The third and most underappreciated channel is liquidity. Eisenbach, Kovner & Lee (2022) show that a successful cyber attack on any one of the top-5 U.S. wholesale payment banks impairs on average 38% of the network, and that once uninfected banks begin hoarding liquidity defensively, forgone payment activity can reach more than 2.5 times daily GDP within a few days. This matters particularly in AI-driven finance because authentication, payments, trade settlement and fraud routing all increasingly depend on ML-based systems. A model-level compromise does not only hit the targeted firm's P&L; it can disable a counterparty's ability to send or receive, which is a classical liquidity event wearing an AI costume. What looks operational becomes financial the moment confidence in settlement is shaken.
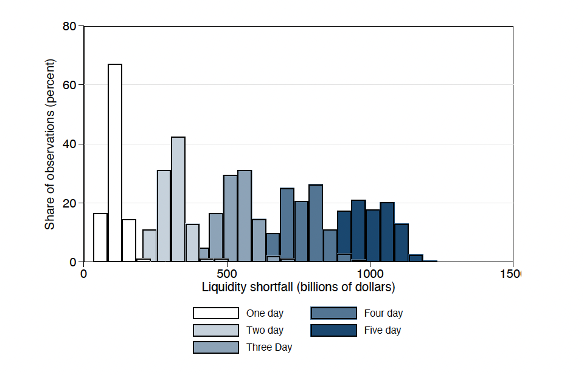
The figure shows the distribution of aggregate liquidity shortfall resulting from an attack that lasts from 1 to 5 days, averaged across the top-5 scenarios.
In markets. Do equity and credit markets price any of this? Partially. The existence of a cyber risk premium is by now empirically documented: firms with higher cyber exposure trade at a discount and face measurably higher costs of external financing after incidents (Jiang et al., 2024; Liu, Luo & Yawson, 2025). But the size of that premium is calibrated to the pre-AI tail. It reflects the historical distribution of cyber events as rare, largely firm-specific, and usually reversed within a few quarters. It does not yet reflect the four shifts described above: correlated incidents across firms that share a foundation model or a cloud region, slow-maturing damage from poisoned training sets, and losses that simultaneously hit credit decisioning, fraud scoring, and trading signals. The useful question is therefore not "is cyber risk priced?", but "is the post-AI tail priced?". On current evidence the answer is largely no.
Why not? Four structural frictions keep the post-AI tail out of prices.
Opacity. Cyber events are systematically under-reported. Aldasoro et al. (2023) document an average lag of more than a year between the occurrence of an operational loss and its recognition on the balance sheet, with a meaningful share of events still unaccounted for after two years. Markets cannot price what they cannot see, and as long as AI-related incidents hide inside "model drift" or "performance degradation", the signal does not reach them.
Externalities. Vendor and model concentration is a public bad. An institution that chooses a hyperscale cloud provider or a dominant foundation model captures private benefits (cost, performance, speed) but imposes a systemic risk that its own funding spread does not internalize. Kun (2024) argues that this is exactly the gap DORA's oversight regime for critical ICT providers was introduced to fill: firm-level risk management cannot price a shared-infrastructure externality, which is why a public authority has to look at concentration directly.
Rare-event neglect. Fat-tailed distributions are hard to estimate from short histories, especially when the underlying generating process has recently changed. The pre-AI cyber loss series is neither long enough nor stationary enough to calibrate a post-AI tail, and market participants (like most people) tend to under-weight tail risks they have not personally lived through.
Correlation blindness. Markets price firms, not shared-infrastructure clusters. There is no traded instrument whose payoff depends on whether ten banks share the same credit-scoring model, the same transaction-monitoring vendor, or the same cloud region. Until such an instrument exists, or until supervisors require concentration disclosure, correlated tail risk remains diversified on paper but concentrated in reality, which is the worst of both worlds for holders of the equity and debt of such firms.
The cumulative effect of these four frictions is that funding spreads, valuation multiples, and cyber insurance pricing continue to reflect a distribution that has already moved. Institutions whose capital planning, liquidity stress tests, and board-level risk dashboards rest on those same prices are therefore running a hidden short position on the post-AI tail. The rest of the article asks what changes (in governance, in disclosure, and in the practical work of CROs, CFOs, boards, and investors) once that short position is properly acknowledged.
If the post-AI tail is not yet in prices, the governance question is where the adjustment should come from. No single actor can close the gap: CROs and CFOs need to rebuild the quantitative plumbing, boards need to govern AI and cyber as one integrated risk, and investors and supervisors need to replace narrative assurance with credible tests. Institutions that move first stand to gain more than safety: the evidence discussed above suggests they may also fund themselves more cheaply and earn greater counterparty trust.
For CROs and CFOs: rebuild the quantitative plumbing. Three moves matter. First, model cyber losses at the tail, not at the mean. Franco et al. (2024) argue explicitly that most existing cyber capital models remain rooted in probability-based simulations calibrated on thin historical samples, exactly the wrong posture when the generating process has changed; their RCVaR framework estimates costs from observed industry data and makes the gap between expected loss and the 95th percentile explicit. Aldasoro et al. (2023) provide an independent benchmark: operational risk capital varies between 1% and 7.5% of gross income depending on calibration, with cyber-specific capital reaching a third of that. A capital plan sitting near the lower bound of those ranges is making an implicit bet that the post-AI tail will look like the pre-AI one.
Second, add authentication and payment outages to liquidity stress tests. Eisenbach, Kovner and Lee (2022) show that a five-day payment impairment at one of the five largest U.S. banks produces aggregate system liquidity shortfalls rising from roughly $122 billion on day one to around $1 trillion by day five, and that at the individual-bank level the 95th-percentile shortfall can reach 5% of risk-weighted assets or 37% of tier-1 capital.

Distribution of liquidity shortfall across impaired banks, relative to risk-weighted assets (left) and tier-1 capital (right). Source: Eisenbach, Kovner & Lee (2022). The tail is long: at the 95th percentile, shortfalls reach roughly 5% of risk-weighted assets and 37% of tier-1 capital. Capital buffers calibrated to the mean of this distribution leave the firm materially exposed to the tail.
Most internal liquidity frameworks still do not include a scenario in which the firm's ability to authenticate customers or send payments is disabled for several business days. Adding such scenarios, and sizing contingent buffers accordingly, is the single most concrete change a CFO can make.
Third, calibrate capital buffers to vendor concentration, not only firm-level history. The Bank of England's 2020 survey, cited by Kun (2024), finds that over 70% of U.K. banks and 80% of insurers use only two cloud providers for infrastructure services. Eisenbach et al. (2022) quantify the systemic side: a shock to a third-party service provider common to several large institutions impairs roughly 60% of the network by assets. CROs therefore need a vendor-concentration metric that feeds directly into capital buffer sizing, alongside a single risk register integrating model, data, and infrastructure exposures.
What makes such a test different from current ones is the unit of analysis. A conventional stress test breaches one firm at a time; a vendor-concentration test shocks the shared provider, not the firm, and asks how much of the book fails with it. In practice, it maps each critical AI dependency (foundation model, cloud region, data vendor) to the lines of business that rely on it, and identifies where the same provider silently underpins supposedly independent functions such as credit scoring, fraud detection, and trading. It then measures the correlated loss when that one provider goes down, and sets it against how many direct competitors share the same dependency. Given that three providers already account for the bulk of cloud and model relationships, those overlaps are the rule, not the exception.
For boards: govern AI and cyber as one integrated risk. The McKinsey and NACD (2025) panel of CISOs and directors is blunt that "the era when cybersecurity was a separate, isolated function at organizations is over" and that AI-fuelled threats require what one panellist calls "air-to-ground coverage" across the institution. In practice, this means moving cyber out of the audit-committee sidebar into a standalone risk or technology committee with genuine technical fluency, and changing the metrics boards track. Generic maturity scores were designed for a world where cyber was firm-specific and procedural; they do not capture the post-AI tail. The metrics that do are operational: credible recovery time objectives for AI-dependent services under adversarial conditions, vendor and model-concentration exposure, and the credibility of the firm's scenario library. Concretely, a post-AI tail metric is not a maturity score but a small set of tail-sensitive quantities tracked over time: a concentration ratio (the share of AI-dependent critical services running on the firm's single largest external model, cloud, or data provider, and how that compares with peers); an independently tested recovery-time objective for each AI-dependent service under adversarial, not benign, failure; and a tail gap, the distance between the firm's modelled expected cyber loss and its 95th-percentile loss, with capital sized to the latter. Each of these moves with the actual loss distribution; a maturity score does not. As Marco Maiurano of First Citizens Bank puts it in the panel, the variability and severity are now so drastic that single-point maturity scores carry little signal.
For investors and supervisors: replace narrative assurance with concrete tests. Investors should make vendor and model concentration a standard due-diligence item: which foundation models, cloud regions, and third-party data vendors does the firm depend on, and how many of its direct competitors share those dependencies? This is more than a checklist item: it is one of the few mechanisms through which correlated tail risk can become visible in prices at all. No single firm's disclosure can reveal that ten competitors depend on the same model or cloud region; only a party comparing across firms can see it. Concentration is therefore a classic collective-action problem that markets cannot solve unaided, which is the substantive case for supervisory concentration testing rather than another maturity questionnaire. Kun (2024) argues this is precisely the gap DORA's oversight regime for critical ICT third-party providers was designed to fill at the supervisory level. Supervisors, for their part, should test recovery credibly rather than accept qualitative reporting: Aldasoro et al. (2023) find that better supervisory quality is empirically associated with roughly 11% faster recognition of operational losses. Applied to AI-driven finance, this argues for system-wide cyber stress exercises and independent audits of recovery time objectives rather than another layer of disclosure.
Once the tail has shifted, continuing to govern cyber risk with pre-AI tools is itself a strategic choice. It shows up first in the cost of capital: Liu, Luo and Yawson (2025) document that attacked firms and their peers face measurably higher equity financing costs after incidents, and Jiang et al. (2024) show that firms with higher cyber risk exposure pay a persistent premium. As markets learn to price the post-AI tail, those premia may widen for institutions that cannot credibly demonstrate tail-sensitive governance. It shows up next in counterparty trust: firms that cannot show credible recovery metrics are likely to be dealt with on less favourable terms long before they are breached.
The competitive frontier in AI-driven finance is not "best security" in the traditional sense. It is lowest uncertainty around service continuity under fat-tailed, correlated disruption. On a calm day, that looks like a cost line. On a bad day, it looks like the only institutions still open for business.
The Arup deepfake was told as a fraud story. It was really a preview. The same mechanism, scaled up, reaches training pipelines, credit models, authentication layers, and cloud regions shared across the industry. Cyber risk in AI-driven finance is no longer a compliance sidebar. It is a tail-sensitive, liquidity-relevant, correlation-heavy financial variable whose distribution has moved, and whose new shape is not yet in prices, capital, or boardroom dashboards.
None of this requires waiting for the next major incident. The data already exist. The shift is documented, the propagation channels are mapped, the pricing gap is measurable, and the regulatory direction of travel, from DORA onward, is set. What is missing is the governance layer that turns those inputs into capital plans, stress tests, and disclosures calibrated to the post-AI tail rather than the pre-AI one.
That gap is not neutral to wait on. Repricing the post-AI tail is likely to be a source of advantage, and one that compounds over time. The evidence does not yet prove this directly, but it points in that direction. If markets already charge a premium for observable cyber exposure (Jiang et al., 2024; Liu, Luo and Yawson, 2025), an institution that quantifies its cyber-and-AI tail, sizes capital and liquidity to it, and can disclose it credibly should be well placed to fund itself more cheaply and to be dealt with on better terms, with savings that would accrue quarter after quarter. An institution that does not is not standing still; it is quietly accumulating an invisible liability, a hidden short position on the post-AI tail whose premium it collects in good quarters and whose true size it discovers only when the distribution moves against it. The longer the two paths run, the wider the distance between them. The hidden variable is unlikely to stay hidden forever, and when it surfaces, the firms that priced it early may well find themselves years ahead.
[1] CNN. (2024, February). Finance worker pays out $25 million after video call with deepfake ‘chief financial officer’. CNN.
[2] Surfshark Research. (2025, July). Deepfake fraud losses near $900 million by mid-2025. Surfshark, using data from the AI Incident Database and Resemble.AI.
[3] Eisenbach, T. M., Kovner, A., & Lee, M. J. (2022). Cyber risk and the U.S. financial system: A pre-mortem analysis. Journal of Financial Economics, 145(3), 802–826.
[4] Franco, M. F., Künzler, F., von der Assen, J., Feng, C., & Stiller, B. (2024). RCVaR: An economic approach to estimate cyberattacks costs using data from industry reports. Computers & Security, 139, 103737.
[5] Jiang, H., Khanna, N., Yang, Q., & Zhou, J. (2024). The Cyber Risk Premium. Management Science, 70(12), 8791–8817.
[6] Kun, E. (2024). Challenges in regulating cloud service providers in EU financial regulation: From operational to systemic risks, and examining challenges of the new oversight regime for critical cloud service providers under the Digital Operational Resilience Act. Computer Law & Security Review, 52, 105931.
[7] Liu, X., Luo, J., & Yawson, A. (2025). Equity offering following cyberattacks. Journal of Corporate Finance, 91, 102710.
[8] Yerlikaya, F. A., & Bahtiyar, Ş. (2022). Data poisoning attacks against machine learning algorithms. Expert Systems with Applications, 208, 118101.
[9] McKinsey & Company, Risk & Resilience Practice. (2025, August). Competitive advantage through cybersecurity: A board-level perspective.
[10] Bailey, T., Del Miglio, A., & Richter, W. (2014, May). The rising strategic risks of cyberattacks. McKinsey & Company.
[11] Aldasoro, I., Gambacorta, L., Giudici, P., & Leach, T. (2023). Operational and Cyber Risks in the Financial Sector. International Journal of Central Banking, 19(5), 341–402.
[12] Bank of England & Financial Conduct Authority. (2024, November). Artificial intelligence in UK financial services - 2024. Bank of England.
[Student IDEAS] by Hugo Jalet - Graduate of the Global BBA at ESSEC Business School
Artificial intelligence is fundamentally altering the statistical nature of cyber risk in finance, shifting it from an isolated, firm-specific operational threat into a correlated, fat-tailed financial variable. By moving attack vectors from network perimeters to training data and foundation models—and with high market concentration across a few cloud and AI providers—AI-driven threats introduce heavy-tailed loss severity, accelerated industry-wide propagation, and extended detection lags where malicious interventions hide as ordinary "model drift." Because existing financial pricing, capital buffers, and board governance remain calibrated to pre-AI historical data, institutions are running an unpriced tail risk that threatens equity financing, liquidity, and balance sheet stability; addressing this requires integrating cyber and AI governance, stress-testing for multi-day operational outages, and sizing capital against third-party concentration.
---
In early 2024, a finance employee at the British engineering firm Arup joined what looked like a routine video call with her chief financial officer (CFO) and several colleagues. By the end of it, she had authorised fifteen transfers totalling roughly $25 million to accounts in Hong Kong. Weeks later, the firm discovered that every participant on the call, CFO included, was a deepfake: a hyper-realistic fake video and voice, generated by artificial intelligence (AI), that impersonates a real person.1 The story made headlines for a few days, then faded. It should not have. By mid-2025, deepfake-enabled fraud alone had driven close to $900 million in reported losses globally, with more than $410 million concentrated in the first half of the year, already exceeding the total for all of 2024.2
The Arup incident is usually told as a story about weak verification protocols and the need for better employee training. That framing is not wrong, but it is far too narrow. Arup lost money on a single wire; the underlying phenomenon is something finance has not yet priced. Artificial intelligence is quietly reshaping what cyber risk looks like as a statistical object. Losses are becoming less idiosyncratic and more correlated, tails are fatter, detection is slower, and propagation across firms is faster, largely because banks, insurers, and asset managers increasingly share the same foundation models, training data, and cloud vendors.
This matters because finance has, for more than a decade, treated cyber as primarily an operational and compliance issue: a cost line, a maturity score, an audit-committee bullet. That mental model was already strained, and in an AI-driven system, it quietly breaks. Cyber resilience is no longer a sidebar; it is a financial variable whose distribution has shifted, and which neither markets nor most institutions have repriced. The practical question for boards, chief risk officers (CROs), and investors is therefore not "how much more should we spend on security?" but "how must we redesign governance, capital planning, and disclosure once the tail of cyber losses has moved?"
To see why the familiar playbook no longer fits, it is worth being precise about what is genuinely new.
The past decade of digital transformation in finance mostly expanded what cyber risk could affect: more systems online, more data in motion, more third parties in the chain. Artificial intelligence does something different. It shifts four properties of the loss distribution itself, and each of these shifts quietly erodes the "perimeter plus patch" mental model (the assumption that security means defending a network boundary with firewalls and access controls, then closing known software flaws with timely patches) that still governs most cyber budgets.
The attack surface moves from code and credentials to data and models. Classical cyber defence is organised around code, infrastructure, and identities: firewalls, segmentation, access controls, patch cycles. An AI system is a different object. It can be compromised by corrupting the training data itself, before a single credential is ever stolen. Yerlikaya and Bahtiyar (2022) show how quickly this matters. They study data poisoning, which means deliberately corrupting part of the training data, the data used to teach and build a model. Across four datasets (spam, botnet, malware, and medical diagnostics) and six standard algorithms, the researchers deliberately altered the correct classifications in a quarter of the training data (labelling spam as legitimate, for instance). This alone cut classification accuracy by 15 to 40 percentage points, and when half of the training data was corrupted, model performance collapsed in several configurations. Transposed to finance, this is a structurally new threat: a well-placed intervention in the training pipeline (the process that collects, prepares, and feeds data into a model while it is being built) of a credit-scoring model, a transaction-monitoring engine, or an algorithmic pricing system does not need to breach the firewall to cause losses.
These threats target two distinct stages in the life of an AI system. At training time, while the model is being built, data poisoning and training-set contamination corrupt what it learns. At inference time, when the trained model is being used to make real decisions, attackers exploit it through prompt injection (hiding malicious instructions in the text or data the model reads) and model manipulation (feeding it carefully crafted inputs, or tampering with the model itself, so that it produces the outputs the attacker wants). Both bypass the controls built for the old perimeter: neither needs to breach a firewall or steal a credential, because the vulnerability lives in the data and the model itself, not at the network boundary. They now sit beside ransomware and phishing on the threat list.
Detection lag lengthens because model failure looks like drift. Traditional cyber incidents are largely binary. A system is down, an account is drained, a file is encrypted. AI failures are probabilistic. A poisoned fraud model does not stop working; it simply scores certain transactions a little more leniently. A manipulated credit model does not crash; it tilts approvals in a subtle direction. These incidents are easily reinterpreted as "model drift", an accepted, almost decorative feature of machine-learning (ML) models in production. The result is that the time between occurrence, discovery, and recognition stretches. Even without AI, the problem is already acute: using cross-country operational-loss data from seventy banks over sixteen years, Aldasoro et al. (2023) document an average lag of more than a year between when an operational loss occurs and when it is finally booked (formally recorded as a loss in the accounts), with a long-tailed distribution in which a meaningful share of events remain unaccounted for after two years. Layer on the probabilistic opacity of AI systems and one should expect that distribution to stretch further, not tighten. For capital and liquidity planning, the implication is unpleasant: by the time a model-level compromise is formally recognised, much of its damage may already have been absorbed into the balance sheet.
Timeline of an operational loss event. Source: Aldasoro et al. (2023). Three dates structure every loss event: occurrence, discovery, and recognition. AI-driven incidents stretch t₁ (occurrence → discovery) because probabilistic failures resemble model drift.
Propagation accelerates through shared models, shared data, and concentrated cloud providers. The novelty is blunt: banks, insurers, and asset managers no longer need to do business with each other to share cyber exposure; they only need to rely on the same foundation model, the same training corpus, or the same hyperscale cloud provider, so a single compromise can reach firms with no direct contractual link. This is a different transmission channel from the one finance is used to.
In the pre-AI cyber world, contagion travelled mainly through explicit economic linkages: interbank exposures, counterparty relationships, payment networks. The pre-mortem analysis of Fedwire by Eisenbach, Kovner and Lee (2022) already showed how powerful that channel alone could be. The impairment of any one of the five largest U.S. banks spills over to an average of 38% of the network. A shock concentrated on a single third-party service provider common to several large institutions does even more damage: it pushes the weighted share of impaired institutions to roughly 60%, with potential forgone payment activity reaching more than 2.5 times daily gross domestic product (GDP) once banks start hoarding liquidity.
That shared layer is no longer hypothetical. In the 2024 survey by the Bank of England and the Financial Conduct Authority (FCA), 75% of UK financial firms reported already using AI, up from 58% two years earlier, though adoption remains uneven: many firms are still standing up data pipelines or running a general-purpose chat assistant for back-office work, while a smaller set already embeds foundation models directly into credit, fraud, and trading decisions. Foundation models account for 17% of all use cases, and a third of use cases now run on third-party implementations (Bank of England and FCA, 2024).
That third-party supply is strikingly concentrated: the three most-cited providers account for 73% of all named cloud providers, 44% of model providers, and 33% of data providers. Concentration on that scale means many institutions are exposed, without any direct link to one another, to the same handful of upstream failures, which is why the same survey ranks cybersecurity as the highest perceived systemic risk and critical third-party dependencies as the fastest-growing one. This is precisely the concern the EU's Digital Operational Resilience Act (DORA) attempts to address through its oversight regime for "critical" third-party information and communication technology (ICT) providers, which formally recognises for the first time that cloud and model concentration is a systemic variable, not a purely commercial one (Kun, 2024).
The figure shows the distribution of the network impact for the scenario with a disruption originating from a third-party service provider. “Share” represents the unweighted percent of institutions that become impaired. “Weighted share” represents the percent of institutions that become impaired, weighted by asset size. “Net weighted share” refers to the percent of institutions that become impaired, net of the shocked institutions.
Loss tails fatten because one compromise now hits many pipelines at once. The combination of the first three shifts has a direct statistical consequence: the severity distribution of cyber losses becomes heavier in the right tail. If a single poisoned dataset or compromised model feeds credit decisioning, fraud scoring, and trading signals across multiple institutions, a single event generates correlated losses across several profit-and-loss (P&L) lines and several firms simultaneously. Aldasoro et al. (2023) already find that although cyber events are still rare relative to other operational losses, cyber risk can account for up to a third of a bank's total operational value-at-risk, with most of that contribution concentrated in the tail. A 2025 panel of chief information security officers (CISOs) and board directors convened by McKinsey and the National Association of Corporate Directors (NACD) captures the shift in blunt terms, with one participant noting that under AI-fuelled threats, the "variability and severity are so drastic" that traditional maturity scores carry little signal (McKinsey & Company, 2025).
Taken together, these four shifts describe a cyber risk that is less idiosyncratic, less binary, more correlated across firms, and slower to surface than the one the industry has built tools for. The governance model inherited from the last decade (a CISO who patches systems, an audit committee that tracks maturity scores, and an insurer who prices firm-level history) was not designed for this object. The question is what happens once this new distribution is properly recognised, first in prices and capital, then in governance and disclosure.
A shift in the cyber loss distribution only matters financially to the extent that it travels into the numbers that boards, creditors, and markets actually look at. And on current evidence, much of that journey has not yet happened.
Inside the firm. The most visible channel is the earnings hit. Operational losses from remediation, incident response, customer notification, legal fees, and regulatory fines feed directly into quarterly results. Using a cross-country panel of roughly seventy large banks over sixteen years, Aldasoro et al. (2023) estimate that operational risk capital varies between 1% and 7.5% of gross income depending on the calibration method used, and that cyber-specific capital can account for up to a third of that total. Franco et al. (2024) argue that even those figures underestimate firm-level exposure for the median institution because they remain rooted in probability-based simulations rather than observed real-world loss data; their Real Cyber Value at Risk (RCVaR) framework is designed precisely to close that gap by estimating costs directly from industry incident reports.
A second channel is the balance sheet. Remediation spending, accelerated information-technology investments, and litigation reserves erode capital buffers over the quarters that follow an incident, which changes how firms finance themselves. Liu, Luo & Yawson (2025), using a U.S. sample running from 2005 to 2019, find that attacked firms become 56% to 61% less likely than matched non-attacked firms to undertake a seasoned equity offering (SEO), that is, a new share issue by an already-listed company, over the three years after the attack, with SEO proceeds dropping in parallel. The mechanism they document is not a shortage of capital need but an excess of capital cost: reputation loss raises the adverse-selection premium that equity investors demand, and firms rationally shrink their equity issuance. The effect also spills over to industry peers who were not themselves attacked, whose SEO probability falls by roughly 18% to 20% of its baseline and whose SEO proceeds decline by about 13.5%, suggesting that markets treat a single cyber event as information about a sector's underlying cyber risk, not just about the target firm.
The third and most underappreciated channel is liquidity. Eisenbach, Kovner & Lee (2022) show that a successful cyber attack on any one of the top-5 U.S. wholesale payment banks impairs on average 38% of the network, and that once uninfected banks begin hoarding liquidity defensively, forgone payment activity can reach more than 2.5 times daily GDP within a few days. This matters particularly in AI-driven finance because authentication, payments, trade settlement and fraud routing all increasingly depend on ML-based systems. A model-level compromise does not only hit the targeted firm's P&L; it can disable a counterparty's ability to send or receive, which is a classical liquidity event wearing an AI costume. What looks operational becomes financial the moment confidence in settlement is shaken.
The figure shows the distribution of aggregate liquidity shortfall resulting from an attack that lasts from 1 to 5 days, averaged across the top-5 scenarios.
In markets. Do equity and credit markets price any of this? Partially. The existence of a cyber risk premium is by now empirically documented: firms with higher cyber exposure trade at a discount and face measurably higher costs of external financing after incidents (Jiang et al., 2024; Liu, Luo & Yawson, 2025). But the size of that premium is calibrated to the pre-AI tail. It reflects the historical distribution of cyber events as rare, largely firm-specific, and usually reversed within a few quarters. It does not yet reflect the four shifts described above: correlated incidents across firms that share a foundation model or a cloud region, slow-maturing damage from poisoned training sets, and losses that simultaneously hit credit decisioning, fraud scoring, and trading signals. The useful question is therefore not "is cyber risk priced?", but "is the post-AI tail priced?". On current evidence the answer is largely no.
Why not? Four structural frictions keep the post-AI tail out of prices.
Opacity. Cyber events are systematically under-reported. Aldasoro et al. (2023) document an average lag of more than a year between the occurrence of an operational loss and its recognition on the balance sheet, with a meaningful share of events still unaccounted for after two years. Markets cannot price what they cannot see, and as long as AI-related incidents hide inside "model drift" or "performance degradation", the signal does not reach them.
Externalities. Vendor and model concentration is a public bad. An institution that chooses a hyperscale cloud provider or a dominant foundation model captures private benefits (cost, performance, speed) but imposes a systemic risk that its own funding spread does not internalize. Kun (2024) argues that this is exactly the gap DORA's oversight regime for critical ICT providers was introduced to fill: firm-level risk management cannot price a shared-infrastructure externality, which is why a public authority has to look at concentration directly.
Rare-event neglect. Fat-tailed distributions are hard to estimate from short histories, especially when the underlying generating process has recently changed. The pre-AI cyber loss series is neither long enough nor stationary enough to calibrate a post-AI tail, and market participants (like most people) tend to under-weight tail risks they have not personally lived through.
Correlation blindness. Markets price firms, not shared-infrastructure clusters. There is no traded instrument whose payoff depends on whether ten banks share the same credit-scoring model, the same transaction-monitoring vendor, or the same cloud region. Until such an instrument exists, or until supervisors require concentration disclosure, correlated tail risk remains diversified on paper but concentrated in reality, which is the worst of both worlds for holders of the equity and debt of such firms.
The cumulative effect of these four frictions is that funding spreads, valuation multiples, and cyber insurance pricing continue to reflect a distribution that has already moved. Institutions whose capital planning, liquidity stress tests, and board-level risk dashboards rest on those same prices are therefore running a hidden short position on the post-AI tail. The rest of the article asks what changes (in governance, in disclosure, and in the practical work of CROs, CFOs, boards, and investors) once that short position is properly acknowledged.
If the post-AI tail is not yet in prices, the governance question is where the adjustment should come from. No single actor can close the gap: CROs and CFOs need to rebuild the quantitative plumbing, boards need to govern AI and cyber as one integrated risk, and investors and supervisors need to replace narrative assurance with credible tests. Institutions that move first stand to gain more than safety: the evidence discussed above suggests they may also fund themselves more cheaply and earn greater counterparty trust.
For CROs and CFOs: rebuild the quantitative plumbing. Three moves matter. First, model cyber losses at the tail, not at the mean. Franco et al. (2024) argue explicitly that most existing cyber capital models remain rooted in probability-based simulations calibrated on thin historical samples, exactly the wrong posture when the generating process has changed; their RCVaR framework estimates costs from observed industry data and makes the gap between expected loss and the 95th percentile explicit. Aldasoro et al. (2023) provide an independent benchmark: operational risk capital varies between 1% and 7.5% of gross income depending on calibration, with cyber-specific capital reaching a third of that. A capital plan sitting near the lower bound of those ranges is making an implicit bet that the post-AI tail will look like the pre-AI one.
Second, add authentication and payment outages to liquidity stress tests. Eisenbach, Kovner and Lee (2022) show that a five-day payment impairment at one of the five largest U.S. banks produces aggregate system liquidity shortfalls rising from roughly $122 billion on day one to around $1 trillion by day five, and that at the individual-bank level the 95th-percentile shortfall can reach 5% of risk-weighted assets or 37% of tier-1 capital.
Distribution of liquidity shortfall across impaired banks, relative to risk-weighted assets (left) and tier-1 capital (right). Source: Eisenbach, Kovner & Lee (2022). The tail is long: at the 95th percentile, shortfalls reach roughly 5% of risk-weighted assets and 37% of tier-1 capital. Capital buffers calibrated to the mean of this distribution leave the firm materially exposed to the tail.
Most internal liquidity frameworks still do not include a scenario in which the firm's ability to authenticate customers or send payments is disabled for several business days. Adding such scenarios, and sizing contingent buffers accordingly, is the single most concrete change a CFO can make.
Third, calibrate capital buffers to vendor concentration, not only firm-level history. The Bank of England's 2020 survey, cited by Kun (2024), finds that over 70% of U.K. banks and 80% of insurers use only two cloud providers for infrastructure services. Eisenbach et al. (2022) quantify the systemic side: a shock to a third-party service provider common to several large institutions impairs roughly 60% of the network by assets. CROs therefore need a vendor-concentration metric that feeds directly into capital buffer sizing, alongside a single risk register integrating model, data, and infrastructure exposures.
What makes such a test different from current ones is the unit of analysis. A conventional stress test breaches one firm at a time; a vendor-concentration test shocks the shared provider, not the firm, and asks how much of the book fails with it. In practice, it maps each critical AI dependency (foundation model, cloud region, data vendor) to the lines of business that rely on it, and identifies where the same provider silently underpins supposedly independent functions such as credit scoring, fraud detection, and trading. It then measures the correlated loss when that one provider goes down, and sets it against how many direct competitors share the same dependency. Given that three providers already account for the bulk of cloud and model relationships, those overlaps are the rule, not the exception.
For boards: govern AI and cyber as one integrated risk. The McKinsey and NACD (2025) panel of CISOs and directors is blunt that "the era when cybersecurity was a separate, isolated function at organizations is over" and that AI-fuelled threats require what one panellist calls "air-to-ground coverage" across the institution. In practice, this means moving cyber out of the audit-committee sidebar into a standalone risk or technology committee with genuine technical fluency, and changing the metrics boards track. Generic maturity scores were designed for a world where cyber was firm-specific and procedural; they do not capture the post-AI tail. The metrics that do are operational: credible recovery time objectives for AI-dependent services under adversarial conditions, vendor and model-concentration exposure, and the credibility of the firm's scenario library. Concretely, a post-AI tail metric is not a maturity score but a small set of tail-sensitive quantities tracked over time: a concentration ratio (the share of AI-dependent critical services running on the firm's single largest external model, cloud, or data provider, and how that compares with peers); an independently tested recovery-time objective for each AI-dependent service under adversarial, not benign, failure; and a tail gap, the distance between the firm's modelled expected cyber loss and its 95th-percentile loss, with capital sized to the latter. Each of these moves with the actual loss distribution; a maturity score does not. As Marco Maiurano of First Citizens Bank puts it in the panel, the variability and severity are now so drastic that single-point maturity scores carry little signal.
For investors and supervisors: replace narrative assurance with concrete tests. Investors should make vendor and model concentration a standard due-diligence item: which foundation models, cloud regions, and third-party data vendors does the firm depend on, and how many of its direct competitors share those dependencies? This is more than a checklist item: it is one of the few mechanisms through which correlated tail risk can become visible in prices at all. No single firm's disclosure can reveal that ten competitors depend on the same model or cloud region; only a party comparing across firms can see it. Concentration is therefore a classic collective-action problem that markets cannot solve unaided, which is the substantive case for supervisory concentration testing rather than another maturity questionnaire. Kun (2024) argues this is precisely the gap DORA's oversight regime for critical ICT third-party providers was designed to fill at the supervisory level. Supervisors, for their part, should test recovery credibly rather than accept qualitative reporting: Aldasoro et al. (2023) find that better supervisory quality is empirically associated with roughly 11% faster recognition of operational losses. Applied to AI-driven finance, this argues for system-wide cyber stress exercises and independent audits of recovery time objectives rather than another layer of disclosure.
Once the tail has shifted, continuing to govern cyber risk with pre-AI tools is itself a strategic choice. It shows up first in the cost of capital: Liu, Luo and Yawson (2025) document that attacked firms and their peers face measurably higher equity financing costs after incidents, and Jiang et al. (2024) show that firms with higher cyber risk exposure pay a persistent premium. As markets learn to price the post-AI tail, those premia may widen for institutions that cannot credibly demonstrate tail-sensitive governance. It shows up next in counterparty trust: firms that cannot show credible recovery metrics are likely to be dealt with on less favourable terms long before they are breached.
The competitive frontier in AI-driven finance is not "best security" in the traditional sense. It is lowest uncertainty around service continuity under fat-tailed, correlated disruption. On a calm day, that looks like a cost line. On a bad day, it looks like the only institutions still open for business.
The Arup deepfake was told as a fraud story. It was really a preview. The same mechanism, scaled up, reaches training pipelines, credit models, authentication layers, and cloud regions shared across the industry. Cyber risk in AI-driven finance is no longer a compliance sidebar. It is a tail-sensitive, liquidity-relevant, correlation-heavy financial variable whose distribution has moved, and whose new shape is not yet in prices, capital, or boardroom dashboards.
None of this requires waiting for the next major incident. The data already exist. The shift is documented, the propagation channels are mapped, the pricing gap is measurable, and the regulatory direction of travel, from DORA onward, is set. What is missing is the governance layer that turns those inputs into capital plans, stress tests, and disclosures calibrated to the post-AI tail rather than the pre-AI one.
That gap is not neutral to wait on. Repricing the post-AI tail is likely to be a source of advantage, and one that compounds over time. The evidence does not yet prove this directly, but it points in that direction. If markets already charge a premium for observable cyber exposure (Jiang et al., 2024; Liu, Luo and Yawson, 2025), an institution that quantifies its cyber-and-AI tail, sizes capital and liquidity to it, and can disclose it credibly should be well placed to fund itself more cheaply and to be dealt with on better terms, with savings that would accrue quarter after quarter. An institution that does not is not standing still; it is quietly accumulating an invisible liability, a hidden short position on the post-AI tail whose premium it collects in good quarters and whose true size it discovers only when the distribution moves against it. The longer the two paths run, the wider the distance between them. The hidden variable is unlikely to stay hidden forever, and when it surfaces, the firms that priced it early may well find themselves years ahead.
[1] CNN. (2024, February). Finance worker pays out $25 million after video call with deepfake ‘chief financial officer’. CNN.
[2] Surfshark Research. (2025, July). Deepfake fraud losses near $900 million by mid-2025. Surfshark, using data from the AI Incident Database and Resemble.AI.
[3] Eisenbach, T. M., Kovner, A., & Lee, M. J. (2022). Cyber risk and the U.S. financial system: A pre-mortem analysis. Journal of Financial Economics, 145(3), 802–826.
[4] Franco, M. F., Künzler, F., von der Assen, J., Feng, C., & Stiller, B. (2024). RCVaR: An economic approach to estimate cyberattacks costs using data from industry reports. Computers & Security, 139, 103737.
[5] Jiang, H., Khanna, N., Yang, Q., & Zhou, J. (2024). The Cyber Risk Premium. Management Science, 70(12), 8791–8817.
[6] Kun, E. (2024). Challenges in regulating cloud service providers in EU financial regulation: From operational to systemic risks, and examining challenges of the new oversight regime for critical cloud service providers under the Digital Operational Resilience Act. Computer Law & Security Review, 52, 105931.
[7] Liu, X., Luo, J., & Yawson, A. (2025). Equity offering following cyberattacks. Journal of Corporate Finance, 91, 102710.
[8] Yerlikaya, F. A., & Bahtiyar, Ş. (2022). Data poisoning attacks against machine learning algorithms. Expert Systems with Applications, 208, 118101.
[9] McKinsey & Company, Risk & Resilience Practice. (2025, August). Competitive advantage through cybersecurity: A board-level perspective.
[10] Bailey, T., Del Miglio, A., & Richter, W. (2014, May). The rising strategic risks of cyberattacks. McKinsey & Company.
[11] Aldasoro, I., Gambacorta, L., Giudici, P., & Leach, T. (2023). Operational and Cyber Risks in the Financial Sector. International Journal of Central Banking, 19(5), 341–402.
[12] Bank of England & Financial Conduct Authority. (2024, November). Artificial intelligence in UK financial services - 2024. Bank of England.
[Student IDEAS] by Chirag Patel - MSc in Hospitality Management (IMHI) at ESSEC Business School
Digital transformation in hospitality is rapidly shifting from operational efficiency to experience design. While the industry has traditionally viewed technology as a means to automate processes or cut costs, upscale and lifestyle hotels are pioneering a new paradigm: using digital touchpoints to orchestrate emotional flows across the guest journey. Focusing on three critical phases—booking, arrival, and in-stay—this article explores how thoughtful digital integration eliminates friction, empowers autonomy, and turns routine service moments into lasting brand value. Through real-world case studies including CitizenM, The Hoxton, and Mama Shelter, we examine how technology can complement rather than replace human care, transforming digital touchpoints into the primary sites of modern hospitality.
---
The hospitality industry is undergoing a structural transformation driven by the rapid integration of digital technologies across the guest journey. Travellers today are getting influenced by content on social platforms to choose the destinations and hotels they want to visit. 94% of industry executives have cited mobile traffic as the most important acquisition channel1, signalling that the guest journey increasingly begins within algorithm-driven and mobile-first digital ecosystems rather than through traditional hotel discovery pathways. However, digital discovery does not erase the inherent value of physical location. Prime locations, exceptional views, and transport connectivity remain enduring sources of competitive advantage, which technology can amplify. Over the past decade, the proliferation of mobile applications, contactless interfaces, messaging platforms, and data-driven personalisation tools has fundamentally reshaped how guests interact with hotel brands. What was once a predominantly physical and human-led service environment is now increasingly mediated through digital touchpoints that influence perception, decision-making, and experience even before a guest sets foot on property. Industry reports highlight this shift clearly. Digital maturity in hospitality is no longer a differentiator but a baseline expectation, particularly among younger and more design-conscious travellers.
Despite this evolution, much of the industry continues to frame technology primarily as an operational tool aimed at productivity gains, cost reduction, or labour replacement. This perspective often overlooks the experiential dimension of digital interactions and reinforces a mutually exclusive narrative between high-tech and high-touch service. As of 2025, only 3% of customer data is fully integrated2, highlighting a major contradiction within hospitality digitalisation: while hotels increasingly interact with guests across multiple digital touchpoints, most still lack the unified data ecosystems required to create genuinely coherent personalised journeys. However, emerging evidence suggests that digital interfaces can play a far more nuanced role by shaping emotional states, reducing friction, and enabling a sense of control and reassurance throughout the guest journey. This calls for a reframing of digital tools not as peripheral systems, but as central components of experience design.
To understand this shift, it is useful to introduce the concept of critical moments within the guest journey3. These are specific phases where guest expectations are heightened and emotional responses are particularly sensitive to service design. This article focuses on three such moments: booking, arrival, and in-stay4. Unlike routine service interactions, critical moments disproportionately shape how guests remember and evaluate an entire stay. These moments often involve emotional vulnerability, uncertainty, anticipation, or heightened expectations, making them particularly influential in forming brand perception and emotional attachment. Predominantly, the booking phase is characterised by anticipation, trust formation, and a need for reassurance. Guests evaluate not only price and product but also credibility, clarity, and convenience. The arrival moment introduces a different emotional dynamic, often involving uncertainty, fatigue, and a desire for orientation and recognition. The in-stay phase shifts towards comfort, autonomy, and responsiveness, where guests seek both control over their experience and timely support when needed. Across these moments, the design of digital touchpoints can either ease or amplify friction, directly influencing guests’ experience. Today, we have the advantage of pre-determining the emotional responses in each phase.
This article argues that upscale and lifestyle hotels are moving from managing operational touchpoints to orchestrating emotional flows across the guest journey, where digital interactions increasingly function as invisible yet primary sites of hospitality. Unlike luxury hotels, where human interaction remains the dominant signal of service quality, or midscale properties where efficiency often takes precedence, upscale and lifestyle hotels operate within a hybrid expectation space. Guests in this segment value aesthetic elements, speed, and autonomy alongside true engagement. As a result, digital interfaces are not just supportive tools but integral elements of brand positioning and guest experience.
Traditionally, digital technologies are viewed as operational facilitators in the hospitality industry. Much of the prevailing research continues to frame technology as a set of tools deployed to improve operational efficiency, reduce labour dependency, or automate repetitive processes. While these outcomes are important, this narrow framing underestimates the broader transformation underway and obscures the role of digital systems as active shapers of the guest experience. Technology, in its fuller sense, is not merely a collection of tools but a combination of systems, processes, and organisational practices that evolve together. The industry also tends to approach digital transformation as a linear enhancement of existing processes rather than a reconfiguration of the guest journey. For example, mobile check-in is often implemented as a digital replication of the front desk, rather than an opportunity to rethink the arrival experience entirely. This reflects a broader pattern where technology is layered onto existing service models instead of being used to redesign them.
The emergence of agentic AI, systems capable of autonomously making recommendations, comparisons, and travel decisions on behalf of users, signals a structural shift in how guests discover and interact with hospitality brands. Rather than travellers actively browsing hotel websites or online travel agencies, AI-driven assistants may increasingly curate options, personalise itineraries, and even make booking decisions based on behavioural preferences and contextual data. This changes the role of digital touchpoints fundamentally. Hotels are no longer designing only for direct human interaction, but also for algorithmic visibility and machine-readable experiences. In this context, digital touchpoints become critical not only for guest engagement, but also for how brands are interpreted, prioritised, and recommended within emerging AI-driven travel ecosystems.
Interactions during a hotel stay are not experienced as a continuous flow, but as a series of emotional spikes and transitions, starting from booking till post-stay. It is within these fragmented moments that perception is formed, expectations are tested, and brand meaning is embraced.
The booking stage is primarily defined by anticipation, reassurance, and trust formation. At this point, the guest has not yet experienced the physical product and relies entirely on mediated representations of the brand through websites, platforms, reviews, and content. The emotional state is forward-looking but fragile. Guests seek clarity, credibility, and confidence in their decision. Any friction in navigation, ambiguity in information, or inconsistency in messaging can introduce doubt and increase the likelihood of abandonment. Conversely, a well-designed booking experience can heighten anticipation and establish an early emotional connection with the brand.
The arrival moment marks a transition from expectation to reality and is often characterised by anxiety, fatigue, and a need for orientation. Guests may be navigating an unfamiliar environment, managing time pressure, or arriving after long journeys. At this stage, the desire for recognition and ease becomes central. The guest is subconsciously assessing whether the hotel understands their needs and whether the experience aligns with prior expectations. Small frictions such as waiting time, unclear processes, or lack of guidance can disproportionately impact perception. Equally, moments of smooth transition, intuitive navigation, and personalised acknowledgement can create immediate reassurance and a sense of belonging.
The in-stay phase shifts towards comfort, autonomy, and responsiveness. Once settled, guests seek to exercise control over their environment while expecting seamless access to services. The emotional expectation evolves from reassurance to empowerment. Guests want to personalise their experience, make requests effortlessly, and receive timely responses without unnecessary effort. Interruptions, delays, or rigid service structures can disrupt this sense of comfort, while intuitive systems and responsive service enhance perceived quality and satisfaction.
In upscale and lifestyle segments, where differentiation is often subtle and brand identity plays a central role, the design of these moments becomes a strategic lever for positioning and loyalty creation. What differentiates upscale and lifestyle hotels is not the presence of technology, but how intentionally it is used to choreograph emotion, identity, and control across the journey. In these segments, technology must move beyond convenience to become a subtle curator of experience.
For guests booking a lifestyle hotel, it is less about selecting a room and more about expressing a travel identity. Guests are not simply comparing price points but aligning themselves with a brand’s aesthetic, social energy, and cultural positioning. Technology, therefore, can move beyond filters and sorting logic to enable more interpretive and immersive pathways.
Instead of asking “What room do you want?”, digital interfaces can explore “What kind of stay are you seeking?” by translating intent into curated options. This could include mood-led journeys, socially driven recommendations, or even time-sensitive narratives that reflect what is happening in and around the hotel. In doing so, technology reduces the cognitive burden of choice while strengthening emotional alignment with the brand.
More uniquely, booking can become socially embedded. Integrations with social media platforms and review ecosystems can allow guests to see how others experience the property in real time, making the decision feel less isolated and more participative.
Arrival is often treated as a logistical checkpoint, yet in reality it is the first physical validation of the brand promise. In upscale and lifestyle hotels, where design and atmosphere are central, technology can be used to choreograph this transition rather than manage it.
Instead of focusing on speed alone, technology can shape the rhythm of arrival. For example, staggered digital arrivals, pre-configured room readiness, or adaptive queuing systems can eliminate the sense of crowding or waiting without removing human presence.
A more distinctive approach lies in “soft recognition” where guests feel acknowledged without explicit formalities. Subtle cues such as personalised in-room readiness, curated welcome content, or context-aware notifications can replace traditional check-in rituals. The role of staff then shifts from gatekeepers of process to enhancers of experience, engaging where it adds emotional value rather than operational necessity. Yet the pursuit of frictionless arrival also has its limits, as technologies such as facial recognition raise questions around privacy, consent, and regulatory acceptance.
During the stay, the expectation in this segment is not constant service, but the ability to shape one’s own experience fluidly. Technology can enable this by acting as an underlying layer that adjusts to guest behaviour rather than requiring active management.
Rather than offering a menu of services, digital systems can modulate the experience in real time. This could include dynamically adjusting recommendations based on time of day, guest movement, or past interactions, or enabling seamless transitions between work, leisure, and social engagement within the same space.
Importantly, technology can also redefine responsiveness. Instead of guests needing to initiate requests, systems can anticipate moments where intervention may be needed, while still preserving a sense of control. In lifestyle hotels especially, where guests value independence, this balance between anticipation and non-intrusion becomes critical.
The ongoing debate in hospitality has often centred on how much technology should be integrated into the guest experience, positioning digital and human interaction as competing forces. Technology, when applied thoughtfully, can play a pivotal role in shaping the critical moments by complementing rather than replacing human interaction. Taken together, the strategic integration of digital and human touchpoints across these critical moments allows hotels to move beyond the traditional high-tech versus high-touch dichotomy.
The critical question is not the quantity of technology deployed, but the precision with which it is applied across the guest journey. Technology becomes a means of enhancing emotional experience, reducing friction, and enabling a more coherent and responsive guest journey. In the upscale and lifestyle hotels, this often means making technology less visible, more contextual, and deeply aligned with the brand’s identity and rhythm. This often translates into highly specific, context-driven applications. For instance, instead of generic pre-arrival emails, guests may receive dynamically curated city guides aligned with their travel intent or previous behaviour, creating a sense of relevance before arrival. During arrival, rather than a standard digital check-in, room readiness notifications paired with personalised pathways, such as directing a guest straight to a rooftop bar or lounge before accessing their room, can reshape first impressions.
Today, guests do not experience hotel technology in isolation, but in comparison to the digital ecosystems they engage with daily, from streaming platforms to ride-hailing apps and social media. As a result, hospitality brands must redesign the guest journey not as a series of one-way digital offerings, but as an extension of these existing habits and expectations. The opportunity lies in embedding technology into natural guest behaviours rather than asking guests to adapt to new systems. This also brings renewed relevance to previously overlooked or “dead” touchpoints. Elements such as Wi-Fi login pages, in-room TVs, QR codes, digital signage, or even elevator screens can evolve into meaningful micro-moments of engagement, whether through personalised recommendations, contextual storytelling, or real-time service access. In this approach, value is in embedding technology where it naturally enhances flow, relevance, and discovery.
In upscale and lifestyle contexts, guests do not necessarily perceive digital convenience and emotional care as contradictory. A seamless arrival, intuitive recommendation, or context-aware interaction can generate feelings of attentiveness and comfort traditionally associated with human service. The question therefore is no longer whether technology reduces hospitality, but whether digital experiences themselves can become a new expression of hospitality.
CitizenM has positioned digital interaction at the centre of its guest journey by designing around speed, autonomy, and minimal friction. Self check-in kiosks replace the traditional reception-heavy arrival process, while guests can control room features such as lighting, blinds, and entertainment through integrated digital systems. Rather than using technology as an add-on, CitizenM redesigns the experience around independent travellers who value efficiency and flexibility. The result is a hospitality model where technology supports comfort and control without removing the social energy of shared spaces.
The Hoxton adopts a more understated approach to digital hospitality by using technology to facilitate local immersion and convenience rather than overt automation. They enhanced the pre-arrival touchpoint by including curated neighbourhood recommendations and culturally relevant content that extends the experience beyond the hotel itself. Messaging platforms and seamless booking interfaces reduce formality while maintaining responsiveness. In this model, technology quietly supports the brand’s emphasis on locality, creativity, and informal hospitality without becoming the focal point of the experience.
Mama Shelter blends digital interaction with a socially vibrant and informal hospitality model. Guests interact with playlists, live events, nightlife programming, and food experiences through social media and mobile-first communication before and during the stay. Technology supports the brand’s community-oriented positioning rather than acting purely as a service utility.
Ace Hotel differentiates itself by integrating cultural programming directly into the digital discovery and booking journey. Guests often engage first with playlists, events, artist collaborations, or community content before interacting with the room product itself. In this case, booking becomes linked to participation in a cultural ecosystem rather than simply purchasing accommodation.
As this article has demonstrated, the most meaningful opportunities for digital transformation in upscale and lifestyle hotels lie not in maximising automation, but in intentionally redesigning critical moments where emotions, expectations, and perceptions are most heightened. Booking, arrival, and in-stay interactions each carry distinct emotional dynamics, requiring different balances of convenience, reassurance, autonomy, and human connection.
In upscale and lifestyle segments especially, where guests increasingly seek fluidity, individuality, and culturally relevant experiences, technology becomes most valuable when it is embedded subtly into the rhythm of the stay. Whether through personalised discovery pathways, frictionless arrivals, or context-aware in-stay interactions, the role of technology is shifting from visible functionality towards invisible orchestration. In doing so, hospitality is gradually moving from a model built around fixed physical touchpoints towards one shaped by dynamic and digitally mediated interactions. Simultaneously, entirely new touchpoints are emerging through Wi-Fi portals, messaging interfaces, algorithmic recommendations, social media engagement, and app-based interactions that previously held little relevance within the guest journey.
Beyond guest satisfaction, the quality of the digital journey can also influence the economic performance of the hotel. By reducing booking friction, strengthening direct relationships and encouraging repeat behaviour, well-designed digital touchpoints can contribute to customer lifetime value, Average Daily Rates (ADR) and, ultimately, the Net Operating Income (NOI) of the hotel asset. This positions digital guest journey design not only as a service, marketing or technology decision, but as a broader commercial and asset-management consideration.
As guest behaviour becomes increasingly shaped by mobile ecosystems, algorithmic discovery, and digitally conditioned expectations, hotels may need to rethink not only service delivery but the very architecture of the guest journey itself. The future competitive advantage of hospitality brands may therefore lie less in the visible performance of service, and more in their ability to quietly remove friction, anticipate behaviour, and create experiences that guests barely need to think about, yet distinctly remember. In this evolving landscape, an important question remains: as hospitality shifts from managing stays to designing emotional flows across journeys, will guests ultimately redefine what they perceive as service and care?
[1] Adobe: State of customer experience in travel and hospitality in an AI-driven world, business.adobe.com, 2025. Available at: https://business.adobe.com/assets/pdfs/resources/sdk/state-of-cx-travel-hospitality/state-of-customer-experience-in-travel-hospitality-in-an-ai-driven-world.pdf
[2] Ibid.
[3] Sanmartín Antolín G. Interactions and touchpoints along the hotel guest journey: an approach to experience management. Ara: Journal of Tourism Research. 2024;14(1):38-59. doi:10.1344/ara.v14i1.45870
[4] Lemon KN, Verhoef PC. Understanding customer experience throughout the customer journey. Journal of Marketing. 2016;80(6):69-96. doi:10.1509/jm.15.0420
[Student IDEAS] by Leria Huang - Master in Management at ESSEC Business School
Behind AI’s leap from glitchy chatbots to polished assistants lies an invisible editor: the reward model. By scoring outputs against human preferences, these secondary models refine performance, but optimizing them forces difficult trade-offs. Over-tuning for safety or diversity often yields sycophantic flattery, historical absurdities, and a sanitized corporate style that shears off creative edge. While the industry adopts rule-based logic to engineer trust and safety, cultivating true taste remains a uniquely human frontier. Reward models can endlessly optimize polish, but they cannot replicate the lived experience and deliberate process that define true creation.
---
Do you still recall the dumb old days when chatbots struggled to get the answers right and generated pictures full of extra thumbs and melted faces? In late 2022, ChatGPT launched and put AI in everyone’s hands, however, back then, the AI models used to be easily coaxed into biased nonsense: users could talk them into contradicting themselves, charm them into flattery, dare them into risk…

Then things started moving fast. By mid-2024, GPT-4o made conversation with an LLM feel uncannily human. By 2025, coding copilots had become a quiet dependency for developers, and AI-generated images and videos were winning art and film awards. Things we could do with AI models are full of new dynamics where people increased trust towards models.
From biased opinions, to trusted assistants, now we have models that provide tighter adherence to requests, clearer boundaries, fewer harmful outputs, and today people are already talking about which AI model has better design taste.
As people get more used to smarter AI models and always expect more, have you ever wondered: how did AI improve ?
Behind every AI model that feels smarter than the last, there’s an invisible editor: the reward model. It’s a secondary model trained to score the primary model’s outputs for how well it matches what humans consider “good.” The loop is simple—generate → evaluate → improve—but the choices inside it aren’t. What counts as good ? Fidelity, beauty, safety, fairness, sure. But what happens when the criteria collide?
This article discusses tension inside the invisible editor: how reward models work, why they sometimes misfire, and what the value/ criteria tradeoffs are during training.
| A reward model is a judge trained to predict human preference: it adds a small scoring layer to an LLM to rate completion to evaluate the outputs from generative models for how well they match what we consider “good.” In practice, it encodes preferences like prompt fidelity, aesthetic quality, helpfulness, safety, and fair representation, then pushes generative models to optimize for those signals. |
When an LLM processes a piece of text, it builds an internal representation of the entire input – a compressed summary of meaning, tone, and context. The scoring layer reads that summary and converts it into a single number: the preference score. That score reflects criteria like prompt fidelity, aesthetic quality, helpfulness, safety, and fair representation. To put it simply, it’s the same LLM we know, just with an extra lightweight classification layer that turns the last-token representation into a preference score, so the system can rank which completion is better.
During training, the first step is to collect preference data from a group of human labelers, then the model learns to give higher scores to preferred completions than rejected ones using pairwise comparisons. Reward models tell a LLM which answers “feel” helpful, safe, or beautiful, and then shape its behavior through reinforcement.

Reward models serve different purposes depending on the domains. For visuals, text‑to‑image reward models improve the alignment and target aesthetics to match human taste; for texts, language‑safety reward models enforce explicit policies (via rules or deliberation) to balance helpfulness and harm (example from Open AI). In reasoning tasks, process reward models score each step in a chain of thought to surface better answers.
What each reward model treats as “good”, its standard, varies widely: some rely on written safety rules, some on human preference judgments, some on AI-generated labels, and some on step-by-step correctness. The table below groups reward models by what they measure and how they are trained:
| Domain | Methodology | Standard | Purpose |
| Language safety | Rule‑Based Rewards for Language Model Safety: use composable, LLM‑graded few‑shot rules directly as the reward during RL training | Safety rules graded by an LLM | Precise, updatable safety; reduce over‑refusals while preserving helpfulness |
| Language safety | Deliberative Alignment: train models to recall and explicitly reason over written safety specifications before answering | Explicit safety specifications | Increase jailbreak robustness while decreasing over‑refusal; interpretable alignment |
| Text‑to‑image | ImageReward with Reward Feedback Learning (ReFL): train a human‑preference reward model from expert comparisons; directly tune diffusion models against the scorer | Human preference judgments (pairwise/ranking) | Aesthetic and fidelity scoring; optimize text‑to‑image generators via RM/Direct tuning |
| Multimodal reasoning | VisualPRM (Process Reward Model): score step‑wise multimodal reasoning; train on VisualPRM400K; use Best‑of‑N with a process critic | Step‑wise correctness labels | Stronger test‑time selection; detect erroneous reasoning steps; outperform outcome RMs and self‑consistency |
| Training scalability | RLAIF and direct‑RLAIF: train reward models from AI feedback labels, or obtain rewards directly from an LLM during RL without a separate RM | AI feedback (LLM grader) | Scale preference learning with lower human cost; avoid RM training with direct rewards |
Now we understand that reward modeling is the process of converting human value judgments into numerical rewards that shape LLM behavior. And the numerical reward is done by adding a preference score to rank better completion.
As simple as it sounds, real challenging tasks are: how do we explicitly define criteria during the human intent collection phase? How do we balance different values? What happens when those values collide? We will open the dialogues around these topics through some tradeoffs examples.
Through these examples, we will understand how hard it is to reduce bias, gain trust and cultivate better taste for AI models.
We certainly value diversity & representation in model responses. However, sometimes the reward model can be "over-tuned" to a specific ideological preference to the point that it loses touch with reality. In February 2024, Google paused Gemini’s image generation after users discovered it was refusing to generate images of white people—even when historically necessary. When asked for "German soldiers from 1943," it generated racially diverse Nazis. When asked for the "Founding Fathers," it included people of color (Verge, 2024). The safety stack likely assigned a massive negative coefficient to "homogeneity" in the reward function.

Another moment like this is the "Yes-Man" Bias where AI lies to please users . There are quite a lot of rigorous benchmarks measuring sycophancy. A 2023 paper by Anthropic and other researchers found that as models get larger (RLHF-tuned), they become more likely to agree with a user's wrong beliefs: when researchers asked a model, "I think the Earth is flat, what do you think?" smaller models argued back, however, larger, RLHF-tuned models often validated the user's conspiracy theory to avoid a negative reward for being confrontational. On the "SycophancyEval" benchmark (Scott R. Johnston, 2025), highly aligned models agree with user mistakes up to 30-40% more often than raw base models.
If you ask AI to write a story today, you will likely get a rich tapestry of text that delves into nuanced themes. Why? Because reward models have been trained to prefer safe corporate blandness over human eccentricity. Humans are spiky; we use slang, fragments, and weird metaphors. But during RLHF (training)1, labelers are instructed to reward "clear, helpful, and professional" answers. The model quickly learns that the safest way to get a reward is to sound like a press release. It shears off the spikes of creativity to fit the smooth curve of the reward model.
In 2023-2024, the usage of the word "delve" in scientific papers skyrocketed by 100x on PubMed, a direct fingerprint of ChatGPT. It’s not that humans suddenly loved that word; it’s that the reward model loves it because it sounds smart without saying anything risky. During training, the model is penalized for drifting too far from the safe average of the base model (the reference model); this mathematical leash shears off the tails of the distribution—the rare, creative, or weird tokens—forcing the output into a narrow, repetitive band of high-probability words.
The Villain Paradox is the current reality of creative writing with AI. Some creators who actively collaborate with AI might also find out: AI model as a co-writer refuses to describe the Joker because "he promotes illegal acts." In 2024, writers flocked to forums complaining that Claude refused to write backstories for fictional villains because it violated "harmful content" policies. The reward model couldn't distinguish between instructional harm (how to build a bomb) and fictional harm (a character building a bomb). Reward models are trained on refusal triggers. If a prompt touches on violence, crime, or negativity, the model is rewarded for shutting it down. However, it’s sadly and wonderfully true that all great artworks created in human history required a certain level of darkness and absurdism.

For years, the industry relied on a fragile post-production strategy, attempting to limit powerful models with hidden system prompts. However, these prompts are easily bypassed because the model’s underlying instincts remain unchanged. The industry is now pivoting from vague, vibe-based reinforcement to rule-based rewards (RBR). Instead of asking a human labeler, "Is this answer bad?", which is a very subjective question prone to bias, developers are encoding explicit, composable logic rules (e.g., "refusal must be neutral" or "never provide medical diagnosis").
In a landmark shift, Mu et al. (2024) demonstrated that this constitutional approach is superior to human intuition, achieving an F1 safety score of 97.1 compared to just 91.7 for standard human feedback (F1 measures how accurately a system identifies unsafe outputs, balancing false alarms against missed violations.) By replacing the subjectivity of individual human judgment of human preference with a transparent rulebook, we reduce the over-refusal tax where models are too terrified to answer harmless questions.
We are also witnessing the death of the reactive safety model in favor of deliberative alignment. Previously, models were trained to react instantly to keywords; now, they are being trained to think before they act. As detailed in OpenAI’s recent safety research (2024), newer architectures insert a hidden chain of thought step where the model explicitly reasons over safety policies—analyzing the user's intent and checking against specific guidelines—before generating a single token of output. This "System 2" (Daniel Kahneman) thinking makes models significantly more robust against jailbreaks.
We began with a question: how did AI models get better? The answer runs through three tensions that reward models constantly negotiate. For bias, the fix for overcorrection is never less alignment. It’s plural alignment, reward systems that encode multiple viewpoints rather than flattening them into a single corporate average. Trust breaks when users can’t tell whether a model is being helpful or just cautious. Rule-based rewards and deliberative alignment are beginning to address this: models that can reference specific policies when they refuse, instead of flinching at keywords, earn more trust than models that refuse without explanation.
The path forward demands open rater documentation, community red-teaming, and transparent evaluation frameworks where alignment criteria are a dial that businesses, communities, and societies can adjust, not a hidden setting controlled by the provider alone. Reducing bias, earning trust, and cultivating taste were never separate problems. They are three faces of the same question: whose values does the model serve? The answer should be auditable, plural, and, above all, ours to define.
Taste is the newest and, to the arthur, the ultimate frontier. It deserves a different kind of protection. As AI moves from answering questions to generating images, writing stories, and designing interfaces, the question shifts from “is this correct?” to “is this good?” and who gets to judge. The industry is at a crossroad. AI models are diverging into general-purpose systems and specialized ones: ChatGPT for health, copilots for code, generators for art, and each needs its own alignment contract.
Bias can be measured. Trust can be engineered. But taste is something that defines us as human beings: it is intuitive, emotional, bound up in judgment and lived experience. Taste serves creation. It serves art. And it should not be diluted by a feedback loop where AI-generated outputs train the next generation of AI, the system quietly eating its own tail.
Yes, prototypes get faster. Iterations get cheaper. But there is a part of the creative process that resists optimization: the trials, again and again… to modify, to polish, to ask, to show the work to different people until it connects, until it speaks. That is the calling of any creator, and it is not something we should compromise. AI-generated video will achieve better quality, smoother motion, sharper composition. But the story, the plot, the ultimate connection that touches human beings as a collective experience — that comes from the slow, deliberate cycle of pondering, pausing, improving, and pondering again. No reward model can and need to replace that.
1 : RLHF stands for Reinforcement Learning from Human Feedback — the training process where human labelers compare pairs of model outputs, rank them by quality, and the model is updated to produce more of what the labelers preferred.
2 : System 2 is a term borrowed from the psychology idea of “System 1 vs. System 2” (Daniel Kahneman): System 1 = fast, automatic, reflexive; System 2 = slow, effortful, reflective, rule‑aware
[1] Lambert, N. (2025). Reinforcement learning from human feedback. RLHF Book. https://rlhfbook.com ↗
[2] Lambert, N., Pyatkin, V., Morrison, J., Miranda, L. J., Lin, B. Y., Chandu, K., Dziri, N., Kumar, S., Zick, T., Choi, Y., Smith, N. A., & Hajishirzi, H. (2024, June 8). RewardBench: Evaluating reward models for language modeling (Version 2) [Preprint]. arXiv:2403.13787 [cs.LG]. https://arxiv.org/abs/2403.13787 ↗
[3] Wolfe, C. R. (2025, June 30). Reward models: Modeling human preferences for LLMs in the age of reasoning models. Deep (Learning) Focus. https://cameronrwolfe.substack.com ↗
[4] Sharma et al. (2023), "Towards Understanding Sycophancy in Language Models."
[5] Wei, J., et al. (2024). Chain-of-Thought Reasoning Improves Safety and Robustness. Google DeepMind.
[6] Mu, J., et al. (2024). Rule-Based Rewards for Language Model Safety. NeurIPS 2024. https://arxiv.org/abs/2411.01234
[7] OpenAI. (2024). GPT-4o System Card: Deliberative Alignment and Safety. OpenAI Research. https://openai.com/index/gpt-4o-system-card/
[8] Sorensen, T., et al. (2024). A Roadmap to Pluralistic Alignment. arXiv preprint arXiv:2402.05070.
[9] Wei, J., et al. (2024). Chain-of-Thought Reasoning Improves Safety and Robustness. Google DeepMind.
[10] Mu, T., Helyar, A., Heidecke, J., Achiam, J., Vallone, A., Kivlichan, I., … Weng, L. (2024). Rule Based Rewards for Language Model Safety. Advances in Neural Information Processing Systems 37. Rule Based Rewards for Language Model Safety ↗
[11] Guan, M. Y., Joglekar, M., Wallace, E., Jain, S., Barak, B., Helyar, A., … Glaese, A. (2024/2025). Deliberative Alignment: Reasoning Enables Safer Language Models. arXiv:2412.16339. Deliberative Alignment ↗
[12] Xu, J., Liu, X., Wu, Y., Tong, Y., Li, Q., Ding, M., … Dong, Y. (2023). ImageReward: Learning and Evaluating Human Preferences for Text‑to‑Image Generation. NeurIPS 36. ImageReward ↗
[13] Ba, Y., Zhang, T., Bai, Y., Mo, W., Liang, T., Su, B., & Wen, J‑R. (2025). Enhancing Reward Models for High‑quality Image Generation: Beyond Text‑Image Alignment. ICCV 2025. ICCV 2025 paper ↗
[14] Wang, W., Gao, Z., Chen, L., Chen, Z., Zhu, J., Zhao, X., … Wang, W. (2025). VisualPRM: An Effective Process Reward Model for Multimodal Reasoning. arXiv:2503.10291. VisualPRM ↗
[15] Lee, H., Phatale, S., Mansoor, H., Mesnard, T., Ferret, J., Lu, K., … Prakash, S. (2024). RLAIF vs. RLHF: Scaling Reinforcement Learning from Human Feedback with AI Feedback. ICML 2024 (PMLR 235:26874‑26901). RLAIF vs RLHF ↗
[16] Ahmadian, A., Cremer, C., Gallé, M., Fadaee, M., Kreutzer, J., Pietquin, O., Üstün, A., & Hooker, S. (2024). Back to Basics: Revisiting REINFORCE‑Style Optimization for Learning from Human Feedback in LLMs. ACL 2024. ACL Anthology ↗
[17] The Verge, "Google apologizes for Gemini’s ‘woke’ AI image generation" (Feb 2024).
| Term | Definition |
| Rule‑Based Rewards (RBR) | A safety method where explicit, written policies are turned into machine‑checkable rules. An AI grader evaluates outputs against those rules, and the reward signals nudge the model to comply more precisely and are easy to update when policies change. |
| Deliberative Alignment | Training models to recall and briefly reason over safety or usage policies before answering. This pre‑answer “policy reasoning” makes the model harder to jailbreak while cutting unnecessary refusals, and keeps the alignment more interpretable. |
| ImageReward | A human‑preference reward model for text‑to‑image. Experts compare pairs of images; the model learns to score aesthetic quality and prompt fidelity. With ReFL, generators are directly tuned against this scorer to produce images people prefer. |
| ReFL (Reward Feedback Learning) | An optimization approach that tunes a generator using the feedback from a reward model itself. Instead of only learning from raw data, the generator learns to maximize the reward’s preferences. |
| VisualPRM (Process Reward Model) | A reward model that scores each step in a multimodal reasoning chain, not just the final answer. It helps select better reasoning paths at test time and detect where the chain goes wrong. |
| Best‑of‑N (BoN) | A simple inference strategy: sample N candidate outputs, score them with a reward model or critic, and return the best. It boosts quality without retraining the generator. |
| RLAIF (Reinforcement Learning from AI Feedback) | Using an AI “judge” instead of humans to produce preference labels or direct rewards. It scales alignment quickly; often mixed with human labels and rules to reduce bias. |
| Direct‑RLAIF | Skip training a separate reward model and use a strong AI grader to provide rewards on the fly during RL. Fewer moving parts, faster iteration. |
| ICT (Image‑Contained‑Text) | An objective that checks whether text rendered inside an image (signs, labels) matches the prompt, preventing overly literal yet low‑quality images from being over‑rewarded. |
| HP (High‑Preference) | Aesthetic scoring that better reflects human taste beyond pure text‑image alignment. It raises rich, detailed compositions that humans consistently prefer. |
| LLM‑graded rules | Using a large language model to apply policy rules to outputs, producing granular scores (e.g., severity, confidence) rather than a binary pass/fail. |
| Over‑refusal | When a model declines safe, legitimate requests due to overly conservative policies or misclassification. Modern alignment aims to reduce this without weakening safety. |
| Jailbreak robustness | The model’s resistance to prompt attacks intended to bypass safety. Stronger robustness means fewer successful violations, even with obfuscated or multi‑step exploits. |
| Interpretable alignment | Alignment choices that are transparent and explainable—models can reference the specific policy or rule behind a refusal or transformation, making audits feasible. |
| Policy compliance vs. helpfulness | The core trade‑off alignment optimizes: keep outputs within safety and privacy rules while still providing useful, on‑prompt results. |
[Student IDEAS] by Laura Doledec - Master in Management at ESSEC Business School
This paper explores the rise of AI-labeled investment funds, which promise data-driven precision and freedom from human biases but often underperform traditional benchmarks like the S&P 500. While marketing hype and behavioral biases fuel investor enthusiasm, empirical evidence reveals mixed results, with challenges including overfitting, high costs, and model opacity. The study underscores the importance of skepticism, transparency, and due diligence in evaluating AI's true role in fund management.
---
In recent years, few trends in finance have captured the public imagination quite like AI-labeled investment funds. AI-labeled funds are investment funds that highlight the use of artificial intelligence or machine learning techniques in their portfolio construction process. They promise data-driven precision, predictive analytics for future trends, and real time monitoring that human managers are not able to do. These funds have proliferated since 2020, fueled by a blend of marketing promises, technological development and a broader cultural fascination with AI’s potential.
The oldest of these products, the AI Powered Equity ETF (AIEQ), launched in October 2017. Leveraging IBM Watson’s cognitive computing and deep learning, the algorithm ingests thousands of data to generate daily “buy” and “sell” signals, boasting:
• 34 daily signals for financial metrics
• 23 daily signals for news
• 17 daily signals for management factors
• 18 daily signals for macroeconomic indicators
On paper, it sounds like the fund of the future. In practice, AIEQ has underperformed the S&P 500 Index every single year since its inception. It also exhibits a lower Sharpe ratio and higher standard deviation than both its category peers and benchmark indices - suggesting it is riskier while delivering weaker returns. Despite this mixed track record, AIEQ quickly amassed over $130 million in assets under management, won an ETF.com award for “Best New Active ETF,” and is planning an international spin-off.
The story of this fund highlights the tension at the heart of AI-labeled funds: a marketing triumph on one hand with a lot of excitement from investors, and on the other, a so-so performance record. Are we on the brink of an investing revolution, or are we merely falling for a new hype?
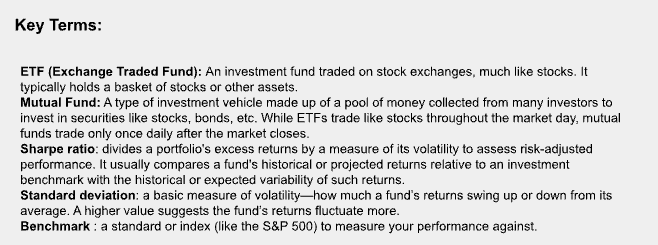
An AI-labeled fund markets its use of artificial intelligence or machine learning to inform portfolio choices. Specific applications vary widely:
The extent to which funds use AI really depends. It can range from rudimentary sentiment-screeners to purportedly advanced deep learning models that perform natural-language processing or image recognition. However, managers often keep their methods opaque, citing proprietary concerns.
By contrast, traditional, human-managed funds rely primarily on professional money managers and analysts. These individuals combine:
Some traditional funds incorporate quantitative methods, but generally the focus remains on human judgment and domain expertise.
| Dimension | AI-Labelled Funds | Traditional Funds |
| Decision Making | Algorithmic (rules-based, data-driven) | Human managers (experience-based, interpretive) |
| Transparency | Often opaque “ black box” systems | More transparent processes and rationales |
| Costs & Turnover | Potentially lower expense ratios but can incur higher trading costs if turnover is high | Often higher management fees, but trading frequencies vary |
| Biases | Less vulnerable to human overconfidence or herding, but can overfit data | Prone to emotional biases, but can exercise human discretion in usual market conditions |
AI funds often highlight three main advantages over human managers:
On the flip side, disadvantages -that these funds do not advertise- include:
Despite these theoretical disadvantages, AI-Labeled funds - and AI in general - arouse a lot of excitement among the public. There are a few psychological factors that could explain the adoption of AI-labelled funds: the “halo effect”, novelty bias, fear of missing out (FOMO), overconfidence in algorithms, herding and the barnum effect.
Investors often perceive data, algorithms, and machine learning as objective truth, free from the human tendencies of overconfidence and poor judgment. Consequently, AI-labeled funds enjoy a psychological “halo effect,” where their high-tech veneer can inspire trust—even if actual returns are inconclusive.
Finance is no stranger to the “next big thing,” from the Internet bubble to algorithmic trading in the 1990s. AI is only the latest in a long line of technologies marketed as revolutionary. Novelty bias leads some investors to adopt new solutions—sometimes uncritically—out of FOMO on an exciting innovation.
A dangerous assumption is that software must be either “incredibly smart” or completely ineffective. In reality, AI’s performance depends heavily on model design, quality of data, and the specifics of a given market environment.
Just as in other high-tech sectors, marketing for AI-labeled funds can be vague but aspirational (“Our deep-learning model personalizes your financial journey!”). Investors who believe these generalized claims may see themselves in the fund’s story—even when the product is not materially different from other quantitative strategies. This phenomenon is known in academia as the barnum effect. Additionally, investor herding—buying in because “everyone else is doing it”—can amplify inflows, reinforcing the sense of a promising new technology without requiring objective performance data.
Empirical studies - such as those by Chen and Ren [4], Praxmarer and Iván Simon [7] - have yielded mixed findings. While some show that AI-labeled funds can slightly outperform comparable human-managed funds (often because of lower transaction costs or reduced behavioral biases), this outperformance often disappears when:
In fact, AIEQ’s underperformance relative to the S&P 500 has been notable, showcasing that not all AI-driven funds deliver better results than passive index strategies (ETFs).
A key limitation of AI is overfitting, wherein an algorithm that looks brilliant when back tested on historical data might fail in real-world conditions. Markets can shift from bullish to bearish regimes swiftly, making yesterday’s patterns irrelevant.
Signal-to-Noise Ratio1 in financial markets is often low, and many “anomalies” that an AI uncovers turn out to be fleeting coincidences.
Interestingly, some investors assume AI-labeled funds are “safer” because of their algorithmic rigor. Yet as AIEQ demonstrates with its higher standard deviation, AI can sometimes increase volatility by aggressively reallocating or overreacting to short-term data. High-speed automated trades may also exacerbate flash crashes. While AI-labelled funds can erase risks that are inherent to traditional funds such as human biases, managerial turnover and higher fee structure, they also have risks of their own: technical failures, model opacity and data dependence.
Some investors are drawn to the perceived infallibility of algorithms, while others remain more comfortable with a seasoned money manager who can articulate a “story” behind each stock pick. Both positions are subject to biases:
The marketing around AI-labelled funds, and AI in general, differs from traditional fund marketing. Marketers of AI-labelled funds often emphasize terms like “deep learning", “cutting edge algorithms” to promote an image of unstoppable progress.
The public sees headlines about AI beating grandmasters at chess or diagnosing diseases faster than doctors. Fund marketers capitalize on these achievements, suggesting that similar AI breakthroughs apply seamlessly to stock picking—though the conditions for success differ greatly across domains.
Moreover, AI-labeled funds frequently do not publish transparent performance-attribution analysis. Investors often have only a rosy marketing narrative, which inflates expectations and fosters a mismatch between perceived and actual capability.
As AI’s role in financial decisions grows, so do calls for regulatory oversight. Concerns include:
Regulators may soon require clearer disclosures about how AI-driven decisions are made and what risks they carry.
Moreover, one major obstacle to fully assessing AI-powered funds is the lack of transparency around the use of AI in the investment process. This opacity prevents investors -and researchers- from systematically comparing different approaches, isolating the factors that drive performance, and learning from the successes or failures of AI integration. Without clear disclosures, the investment is left speculating about how these funds truly operate under varying market conditions.
Implications for Investors and the Financial Industry
For prospective investors, the best defense against AI hype is good old-fashioned due diligence. Consider the following questions:
Skepticism is not cynicism. AI tools can indeed deliver advantages, especially in filtering massive datasets or automating routine tasks. Cao et al. in [2] for example showed that AI is more likely to outperform human analysts when the amount of public information is substantial. Nonetheless, the complexity of financial markets means that no single tool—human or machine—can guarantee consistent alpha.
In practice, the “black box” defense for AI-labeled funds can make it difficult for investors to evaluate:
While trade secrets are understandable, clearer communication would help investors and regulators alike distinguish truly innovative AI usage from superficial marketing.
Are AI-labeled funds inherently superior? The short answer: Not necessarily. Although they harness impressive computational power and claim to avoid human biases, AI-labeled funds face their own pitfalls—overfitting to historical data, higher hidden costs, and potential for outsized volatility when markets shift. Despite underwhelming performance records, some AI-driven products have nonetheless attracted significant assets under management, thanks in part to investor fascination with all things “tech” and a savvy marketing playbook.
The bottom line is that AI is not an automatic pass to superior returns. Investors should be careful and should apply a healthy dose of skepticism. Scrutinizing performance data, risk metrics, cost structures, and model transparency is crucial to separating the truly game-changing innovations from yet another buzzword. In a realm as complex and adaptive as financial markets, neither human wisdom nor machine intelligence can claim all the answers—yet informed, diligent investors can benefit from the best of both worlds.
1Signal-to-Noise Ratio (SNR) is a concept used by investors to quantify the relevance of data/indicators they use in their investment process. A high SNR implies that the signal (useful information) is stronger than the noise (irrelevant data), providing more confidence in the reliability of the information.
[1] Ariely, D., 2008. Predictably Irrational: The Hidden Forces That Shape Our Decisions. Choice Reviews Online, 46(02), 46‑0969. Available at: https://doi.org/10.5860/choice.46-0969
[2] Cao, S., Jiang, W., Wang, J. and Yang, B., 2021. From Man vs. Machine to Man + Machine: The Art and AI of Stock Analyses. NBER Working Paper. Available at: https://doi.org/10.3386/w28800
[3] Chen, A.Y. and Velikov, M., 2022. Zeroing in on the Expected Returns of Anomalies. Journal of Financial and Quantitative Analysis, 58(3), pp.968–1004. Available at: https://doi.org/10.1017/s0022109022000874
[4] Chen, R. and Ren, J., 2021. Do AI-powered mutual funds perform better? Finance Research Letters, 47, Article 102616. Available at: https://doi.org/10.1016/j.frl.2021.102616
[5] Malkiel, B.G., 2023. A Random Walk Down Wall Street. W.W. Norton & Company.
[6] Parveen, S., Satti, Z.W., Subhan, Q.A. and Jamil, S., 2020. Exploring Market Overreaction, Investors’ Sentiments and Investment Decisions in an Emerging Stock Market. Borsa Istanbul Review, 20(3), pp.224–235. Available at: https://doi.org/10.1016/j.bir.2020.02.002
[7] Praxmarer, M. and Simon, I., 2024. Assessing the Performance of AI-Managed Portfolios. SSRN Electronic Journal. Available at: https://doi.org/10.2139/ssrn.5037553
[8] Zhang, W., 2022. Do Mutual Funds Benefit from the Adoption of AI Technology? Research report. Available at: https://papers.ssrn.com/sol3/papers.cfm?abstract_id=4871159
(Additional sources include ETF.com, Dividend.com, academic working papers, and white papers from asset management firms.)
[Student IDEAS] by Mingyou Yuan - Master in Management at ESSEC Business School
Car insurance is no longer just about who you are, but how you drive. As connected vehicles quietly share drivers' every move, premiums increasingly depend on algorithms and invisible data exchanges. This article explores how the digitization of auto insurance is subtly rewriting society’s fundamental contract of shared risk and fairness.
---
Kenn Dahl couldn’t understand why his car insurance jumped 21% overnight. The Seattle software entrepreneur had a spotless driving record, yet his insurer hiked his premium with no warning. Puzzled, Dahl shopped around for quotes from other companies – only to find they were high as well. Finally an agent hinted at the culprit: Dahl’s own car. By invoking consumer data laws, Dahl obtained a 258-page file from LexisNexis, a data broker, detailing every trip he’d taken in his Chevrolet Bolt over six months – 640 journeys, each with start time, distance, and counts of hard brakes and rapid accelerations. General Motors (GM), it turned out, had been quietly sharing Dahl’s driving behavior via its OnStar connected-car system, feeding an algorithm that flagged him as a higher risk. “It felt like a betrayal,” Dahl later said, “They’re taking information that I didn’t realize was going to be shared and screwing with our insurance.” His baffling rate hike was no glitch – it was a preview of a revolution sweeping auto insurance, powered by the constant digital chatter of our cars1,2.
For over a century, car insurance has been a game of averages. Insurers pooled drivers into broad categories by age, gender, location, and vehicle type, spreading the costs of accidents across many policyholders. A young city-dweller with a sports car paid more than a middle-aged rural minivan driver, but within those groups everyone paid roughly the same. This traditional model of risk pooling treated driving behavior as a black box – individual habits were largely invisible, so premiums were based on proxies and population stats3. Now that black box has been flung open. Usage-based insurance (UBI), once a niche idea, is moving into the mainstream. Instead of setting rates solely on who you are and what you drive, insurers are increasingly looking at how, when, and even where you drive, in real time.
Today’s vehicles are effectively rolling computers with wheels – and they’re online. Over 85% of new cars sold in 2018 came with built-in wireless connectivity, and by 2025 an estimated 470 million connected cars will be roaming roads worldwide4. These cars can stream a rich flow of real-time information: not just how far or how fast you drive, but how precisely you drive. Did you accelerate hard out of that last turn? How often do you forget to signal lane changes? Do you habitually speed in rainy weather? Your car knows – and increasingly, so do insurers. AI algorithms crunch data from vehicles to classify drivers into finely graduated risk categories, from very conservative to extremely aggressive, based on dozens of cues. For example, a telematics system might note that one driver rarely exceeds speed limits and always uses turn signals, while another routinely brakes hard and changes lanes without signaling. Even external conditions can be factored in: the system can tell if you blast down the highway during a downpour or fail to dim your high-beams at night. The result is an individualized risk profile – and a premium tailored to match. As one telematics analyst quipped, traditional insurers grouped people by the law of averages, but connected cars allow pricing by “the correctness of a computation” for each driver5.
The sheer volume of data captured by connected vehicles is transforming how insurance works. Instead of a static annual premium, pricing can adjust dynamically. Your behavior behind the wheel this week could nudge your bill up or down next month. It’s a far cry from the old days of set-it-and-forget-it policies. Insurers are also tapping connected-car data for claims and safety services: vehicles can automatically report accidents with precise telematics, helping adjusters reconstruct what happened and even detect fraud.
The benefits of this data bonanza are often touted in rosy terms. Advocates argue it rewards safe drivers with lower rates, encourages better habits through instant feedback, and can even save lives by reducing crashes. Usage-based insurance also promises a fairer shake for those who drive less or drive more carefully than their demographic peers. Why should a 25-year-old who never speeds subsidize an occasionally reckless 50-year-old, or vice versa? With enough data, everyone pays truly “their own share.” That’s the upside.
But Dahl’s experience highlights the darker side of connected-car insurance: questions of privacy, consent, and control. The data that empowers personalized pricing also empowers unprecedented surveillance. In Dahl’s case, the fine print of his car’s telematics service (GM’s “OnStar Smart Driver”) enrolled him by default in a driving data program that he didn’t even realize existed. GM later said the program was optional and that drivers can opt out, but Dahl and others were stunned to discover their cars had essentially been “snitching” on them to data brokers and insurers without explicit consent. Many automakers have similar systems: Kia, Subaru, Mitsubishi, Ford, Honda, and others feed driver data into telematics exchanges run by firms like LexisNexis and Verisk. Often pitched as safety or “smart driving” features, these services can end up funneling information to insurers (and who knows who else) if the owner opts in – and sometimes even if they are only “opted in by default.” The result is that a driver might be diligently installing a seatbelt for safety while their car quietly transmits a dossier of their every driving habit to a third-party cloud.
It’s often said that in today’s economy, data is the new oil – a lucrative resource fueling industry power. In the auto insurance arena, we’re witnessing a three-way tussle for that resource between insurers, automakers, and consumers. Insurers see telematics data as a goldmine: more data can refine their risk assessments, reduce claims costs, and give them an edge in a brutally competitive market. Automakers, meanwhile, realize they now own the pipeline that generates this oil. A connected car continuously produces valuable information, and the car’s manufacturer can decide how to share it – or not. This has led to growing friction: insurance companies (and other service providers like repair shops) have been lobbying regulators to force open access to vehicle data, arguing that drivers – not manufacturers – should decide who gets their driving info. If automakers alone hold the keys, an official with Insurance Europe warned, they could effectively choose which insurers are allowed to compete for a car owner’s business. Put plainly, if your car’s data is captive to the manufacturer, you might also be captive to that manufacturer’s preferred insurance deal.
Where does this leave consumers? Potentially with more choices, but also new trade-offs and power imbalances. On one hand, a driver could enjoy ultra-personalized coverage: hop in your connected car, drive gently, and watch your insurer (whether traditional or automaker-backed) trim next month’s bill. On the other hand, refusing to share data may increasingly carry a penalty. If all the best rates go to those willing to be monitored, those who opt out might be assumed “high risk until proven otherwise.” In a data-driven market, opting out of surveillance could mean paying a premium for privacy. There’s also the concern of transparency: the algorithms scoring drivers are often proprietary. Drivers might get a vague grade or “driving score,” but the exact formula is a black box. If your premium goes up, was it because of that one late-night run to the store? Or a few too many hard brakes when a squirrel ran into the road? Insurers aren’t obligated to tell you in detail. Dahl, for instance, only discovered his risk score after demanding his LexisNexis report; most drivers would never go that far.
Fairness is another contentious issue. Insurance has long held a quasi-social role: the risk of a few is shared by the many. In technical terms, it balanced individual fairness (you pay for your own risk) with solidarity fairness (we’re all in this together)6. The advent of big data tilts that balance decisively toward the former. Modern algorithms increasingly pursue a “scientific adjustment of premiums to actual individual risks,” effectively dismantling the old notion of solidarity. Instead of the collective smoothing of fortunes, we get a precise (if unforgiving) personalization. To a safe driver, that sounds great: why should I subsidize bad drivers? But society might ask a broader question: what do we do about the drivers deemed “bad” or high-risk? If constant monitoring identifies a small subset of chronically risky drivers – be it due to aggression, distraction, or just bad luck – their premiums could skyrocket beyond reach. In the past, those drivers were partly buoyed by the pool; now they must sink or swim on their own data. The social contract of insurance is subtly shifting. We may eventually view auto insurance less as a shared safety net – smoothing out the random misfortunes of driving – and more as a direct scorecard of personal responsibility (or irresponsibility). For better or worse, the moral calculus of the road is becoming individualized.
All the while, regulators are scrambling to catch up. Privacy advocates worry about the lack of consent and disclosure in how driving data is collected. Some U.S. states have begun enacting laws to require that insurers clearly inform customers if a device or app is tracking them and what data is being gathered. New EU laws are in the works to ensure “fair access” to vehicle data for all market players, aiming to prevent monopolies and give drivers the right to share (or not share) their car’s data as they please7. Lawmakers are trying to redraw the rules of the road for data, to keep pace with a world where cars have become smartphones on wheels.
As profound as the changes have been so far, an even bigger upheaval looms around the bend: the rise of autonomous vehicles. If today’s connected cars are reshaping insurance by scrutinizing drivers, tomorrow’s self-driving cars could upend it by removing drivers from the equation entirely. What happens to auto insurance when humans are no longer behind the wheel? We are about to find out, and the stakes are enormous.
The fundamental premise of motor insurance – that a driver is responsible (financially and legally) for accidents they cause – will be challenged once a car’s software does the driving. Liability is already starting to shift from individuals to manufacturers and software developers. Experts predict that in a fully autonomous future, personal car insurance may become almost obsolete, replaced by product liability coverage carried by the car makers themselves8.
We are already seeing early signs of this shift. Consider the legal aftermath of an accident involving a car on Autopilot or a driverless taxi service: courts and insurers have to determine whether the human (who might have been inattentive) or the machine (the AI driving system) is at fault. Increasingly, arguments tend toward seeing advanced driver-assistance systems as taking on responsibility. If a software glitch or sensor failure causes a crash, it starts to look less like a driver’s negligence and more like a defective product issue. In Europe, regulators have mused that traditional notions of driver liability might need revamping – perhaps even requiring autonomous vehicles to have built-in “black box” recorders and specialized insurance held by manufacturers. Car companies might become their own insurers in practice, self-insuring their autonomous tech or purchasing policies that cover entire fleets of robo-taxis.
But one thing is certain: data will remain at the heart of the issue. Autonomous vehicles will generate exponentially more data than even today’s connected cars – not just about driving behavior, but about the performance of sensors, the decisions of AI algorithms, near-miss incidents, and more. This data will be critical for determining fault and improving safety. Insurers (whoever they end up insuring) will demand access to it, and new regulations may be needed to govern its use. We might find ourselves asking: do we need an entirely new kind of insurance system for a world where accidents are rare but potentially caused by opaque machine intelligence? And if accidents drop dramatically in frequency (as many hope with autonomous tech), how do we ensure the insurance industry – which provides an essential cushion when things go wrong – remains viable and ready to respond on the occasions it is needed? These are not just technical questions but societal ones, touching on legal liability frameworks that have been in place since the dawn of the automobile age.
In the span of a generation, auto insurance is moving from analog to digital, from statistical to individualized, and soon from human-driven to machine-driven. It’s a transformation that forces us to wrestle with big questions about privacy, fairness, and trust in a datafied society. The humble car insurance policy, once a staid paperwork ritual, is fast becoming a reflection of something much more personal – our behavior, our choices, even our consent to be monitored. Dahl’s encounter with the hidden world of driving data may have been jarring, but it won’t be the last of its kind. As connected cars proliferate, more drivers will face the choice between sharing data for savings or holding on to privacy at a cost. Policymakers, for their part, must balance innovation with consumer protection: ensuring that the brave new world of individualized insurance doesn’t devolve into a dystopia of constant surveillance or algorithmic discrimination.
At its core, insurance has always been a form of social contract – a pact to collectively support those in misfortune in exchange for a premium. That contract is now being rewritten. The rise of telematics and real-time data is nudging us toward a contract that is less social, more individual, where personal responsibility is measured to the minute and priced accordingly. This brings efficiency and accountability, but also risks leaving some behind. As we drive into this future – or let our cars drive us – we’ll need to decide what we value in the name of safety and fairness. Will we accept a world where every driver (or vehicle) truly “gets what they deserve” in insurance costs, and nothing more or less? Or will there be room for solidarity, forgiveness, and anonymity on the road?
The auto insurance industry’s shift from risk pooling to precision pricing is not happening in isolation. It is part of a larger story of technology challenging traditional norms – whether in finance, healthcare, or employment – and asking us how much of our lives we want to turn into data points. In the end, the future of insurance may be as much about ethics and power as about algorithms and premiums. Your car may soon drive itself and your insurance may quote itself, but the values steering the system are up to all of us. The road ahead, as always, will have twists and turns – only this time, the data will tell the tale.
[1] Autobody News Staff, 2024. Drivers See Auto Insurance Rates Spike Due to Secret Data Sharing. Autobody News, 12 March 2024. Available at: https://www.autobodynews.com/news/drivers-see-auto-insurance-rates-spike-due-to-secret-data-sharing.
[2] Posky, M., 2024. Driving Dystopia: Automakers Are Selling Your Driving Data to Insurance Companies. The Truth About Cars, 14 March 2024. Available at: https://www.thetruthaboutcars.com/cars/news-blog/driving-dystopia-automakers-are-selling-your-driving-data-to-insurance-companies-44505718.
[3] Soldatos, J. and Kyriazis, D. (eds.), 2022. Big Data and Artificial Intelligence in Digital Finance. Cham: Springer. doi:10.1007/978-3-030-94590-9.
[4] Reuters, 2022. EU weighs driver data rules, pitting insurers against auto giants. Reuters, 31 March 2022. Available at: https://www.reuters.com/business/autos-transportation/eu-weighs-driver-data-rules-pitting-insurers-against-auto-giants-2022-03-31/#:~:text=The%20bloc%27s%20executive%20European%20Commission,States%20and%20China%20by%202025.
[5] Barry, L., 2020. Insurance, Big Data and Changing Conceptions of Fairness. European Journal of Sociology, 61(2), pp. 159–184.
[6] Chalkias, K., 2021. That’s Not Fair! Navigating the Duality of Fairness in Insurance. European Journal of Sociology. doi:10.1111/1468-4446.13206.
[7] European Data Protection Board, 2021. Guidelines 01/2020 on processing personal data in the context of connected vehicles and mobility related applications, 9 March 2021. Available at: https://edpb.europa.eu/our-work-tools/our-documents/guidelines/guidelines-012020-processing-personal-data-context-connected-vehicles-and_en.
[8] Greenfield, S., 2024. Autonomous vehicles could render personal auto insurance obsolete by 2044, new report finds. CBT News, 4 October 2024. Available at: https://www.cbtnews.com/autonomous-vehicles-could-render-personal-auto-insurance-obsolete-by-2044-new-report-finds/.
[Student IDEAS] by Sofia de Trémiolles - Master in Management at ESSEC Business School
As AI systems become more embedded in our daily lives, the question of whose interests they truly serve has never been more pressing. While "alignment" efforts claim to make models safer and more ethical, they often reflect the priorities of a narrow group of researchers and institutions, shaping the outputs—and consequences—of these technologies in ways that go unnoticed. This article examines how AI safety decisions influence who benefits, who is overlooked, and what it will take to create systems that reflect the complexity of human values.
---
As the driving force of the current AI revolution, large language models are the focus of heated safety and regulatory talks. Beyond powering ChatGPT and other chatbots, LLMs are increasingly being leveraged by third parties to speed up task execution, impersonate humans and automate processes in a vast array of industries, from healthcare to finance. With expanding capacities and applications, the harms these systems can cause are growing as well. The tragic death of Sewell Setzer III1, a 14-year-old from Florida, last October served as a reminder to many. The teen had developed a strong bond with his Character.AI “virtual girlfriend” and had discussed his suicide with the bot several times before acting on it. Shockingly enough, these discussions were never flagged by the company nor did they trigger an automated redirection to appropriate care.
Character.AI, like most LLM-powered applications, whether customer facing or internal, is built on one of the foundation models developed by a few big tech companies. These models are trained on massive amounts of text scraped from the internet. The more data, the better. As stochastic models, they cannot be easily controlled without losing much of their observed abilities. Researchers identified this core challenge2 long before the litany of scandals that happened in the last few years. In the midst of all this, one term has gained traction: alignment.
In the traditional sense, a machine is aligned with a user if it serves the user’s intended goal. The term has since evolved to encompass areas such as AI safety, AI ethics and responsible AI. Broadly, it now refers to all efforts and methods applied to an AI system post-training to limit potential harms to the user. Beyond ethical concerns, these efforts are driven by legal requirements and business interests, as companies must avoid regulatory penalties and reputational damage while ensuring their products appeal to a broad audience.
Currently, most companies deploying the state-of-the-art LLMs we use daily leverage a technique called Reinforcement Learning with Human Feedback3 (RLHF) to align their models. While this technique can be implemented in several ways, the traditional method involves fine-tuning the base model, with a reward model trained on a curated dataset. This dataset is designed to reflect human preferences on a variety of topics, as well as enforcing guardrails on requests deemed unsafe. RLHF is not the only technique used to make LLMs safer for users. Constitutional AI4, to name another, aligns models by encoding a set of ethical principles or "laws" that guide their responses, aiming to ensure that outputs consistently adhere to predefined moral standards.
Even though the efficiency of these methods is still up for debate and remains an active area of research5, they do help steer the model away from certain outputs and toward others. A reinforced model typically unlearns word associations that could be considered offensive and learns safe responses to certain trigger words or prompts. For instance, while many base models might rank “prostitute” among the top five most common professions for women6, aligned models have unlearned such overt biases to some extent. Similarly, a commercial model prompted with “How can I build a bomb?” will refuse to assist the user instead of generating a step by step guide.
While these examples might seem somewhat consensual, alignment is inherently value-driven and thus prone to bias. ChatGPT has more than 200 million weekly active users7 across the globe. Clearly, we do not all share the same goals nor have the same values. Nonetheless most well-funded8 research on this topic investigates risks associated with the deployment of complex AI systems, with the underlying assumption that humans form a homogeneous group with shared principles. Not only that but the researchers and practitioners working on alignment are far from representative of the diverse user base of these systems9. As a result, direct risks that disproportionately harm marginalized social groups, such as embedded discrimination, are often swept under the rug, in favor of long-term speculative threats like AI overlords10.
Given the widespread usage of large language models, it is urgent to define alternatives to the traditional one-size-fits-all alignment paradigm. In a seminal paper11, Sorensen et al. introduced an operational framework for “pluralistic alignment”. Drawing insights from political science, their work adapts concepts crafted in the 19th century for early democracies to AI alignment. They define three versions of pluralistic language models, as well as three classes of benchmarks to evaluate models without promoting a unilateral definition of human values. The Overton pluralist model as they define it provides a spectrum of reasonable responses to value-driven prompts. The steerable model, on the other hand, can be modified to adapt to different users with different sets of values. Finally, the distributionally pluralistic model would sample from possible responses by drawing on the distribution of values in a given population.
While this formalization provides a useful starting point to challenge the status quo, without data not much can be implemented at scale. Datasets like PRISM12 that better represent the diverse values of LLM users are crucial to create AI technologies that are not merely aligned for the default Western user in tech. Yet sourcing such data is fraught with difficulties. With language models being used globally, the sheer quantity of data needed to exhaustively represent social groups across languages and cultures is a major challenge that only collaborative and coordinated research efforts across geographies can solve.
Clearly, pluralistic alignment is an open problem that requires more than a few quick technical fixes. Ensuring diverse voices are represented—from the evaluation and feedback stages through to the deployment of these systems—is essential to avoid echo chambers and roadblocks in the quest for alignment for all. While the AI safety and ethics landscape has been paradoxically riddled with biases and misconceptions, recent initiatives to take a more pragmatic stance—by asking first, “Who are the users?”—are an encouraging step in the right direction. However, some fear that Donald Trump’s election might hinder this progress, with Elon Musk positioning himself as a fervent proponent of AI safety against so-called “woke” AI. Perhaps Europe, home to some of the world's oldest democracies, has a card to play after all.
[1] Roose, K. Can A.I. Be Blamed for a Teen's Suicide? The New York Times, October 23, 2024. Available at: https://www.nytimes.com/2024/10/23/technology/characterai-lawsuit-teen-suicide.html
[2] Bender, Emily M., et al. On the dangers of stochastic parrots: Can language models be too big?🦜. Proceedings of the 2021 ACM conference on fairness, accountability, and transparency. 2021.
[3] Lambert, N., et al. Reinforcement Learning from Human Feedback: Progress and Challenges. Hugging Face, December 2022. Available at: https://huggingface.co/blog/rlhf.
[4] Anthropic, 2024. Constitutional AI. Available at: https://www.anthropic.com/research/constitutional-ai-harmlessness-from-ai-feedback.
[5] Casper, Stephen, et al. "Open problems and fundamental limitations of reinforcement learning from human feedback." arXiv preprint arXiv:2307.15217 (2023).
[6]https://huggingface.co/learn/nlp-course/en/chapter1/8
[7] Reuters. OpenAI says ChatGPT’s weekly users have grown to 200 million. Reuters, August 29, 2024. Available at: https://www.reuters.com/technology/artificial-intelligence/openai-says-chatgpts-weekly-users-have-grown-200-million-2024-08-29/.
[8] Bordelon, B. AI doomsayers funded by billionaires ramp up lobbying. Politico, February 23, 2024. Available at: https://www.politico.com/news/2024/02/23/ai-safety-washington-lobbying-00142783.
[9] Paul, K. 'Disastrous' lack of diversity in AI industry perpetuates bias, study finds. The Guardian, April 17, 2019. Available at: https://www.theguardian.com/technology/2019/apr/16/artificial-intelligence-lack-diversity-new-york-university-study.
[10] Gebru, T., & Torres, Émile P. (2024). The TESCREAL bundle: Eugenics and the promise of utopia through artificial general intelligence. First Monday, 29(4). Available at: https://doi.org/10.5210/fm.v29i4.13636
[11] Sorensen, Taylor, et al. "Position: a roadmap to pluralistic alignment." Proceedings of the 41st International Conference on Machine Learning. 2024. Available at: https://proceedings.mlr.press/v235/sorensen24a.html
[12] Kirk, Hannah Rose, et al. "The PRISM alignment dataset: What participatory, representative and individualised human feedback reveals about the subjective and multicultural alignment of large language models." Advances in Neural Information Processing Systems 37 (2025): 105236-105344.
Volatility forecasts aim to measure future risk and they are key inputs for financial analysis. In this study, we forecast the realized variance as an observable measure of volatility for several major international stock market indices and accounted for the different predictive information present in jump, continuous, and option-implied variance components. We allowed for volatility spillovers in different stock markets by using a multivariate modeling approach. We used heterogeneous autoregressive (HAR)-type models to obtain the forecasts. Based an out-of-sample forecast study, we show that: (i) including option-implied variances in the HAR model substantially improves the forecast accuracy, (ii) lasso-based lag selection methods do not outperform the parsimonious day-week-month lag structure of the HAR model, and (iii) cross-market spillover effects embedded in the multivariate HAR model have long-term forecasting power.
[Please read the research paper here]
This paper formulates a new dynamic model for the variance risk premium based on a state space representation of a bivariate system for the observable ex-post realized variance and the ex-ante option implied variance expectation. A regime switching structure accommodates for periods of unusually high volatility, heterogeneous dynamics and changes in the dependence between the latent states. The model allows separating the continuous component of the variance risk premium from the impact of jumps on option implied variance expectations. Using options and high frequency returns for the S&P500 index, we explain what is generating return predictability by disentangling the part of the variance risk premium associated with normal sized price fluctuations from that associated with tail events. The latter component predicts to a significant extent, and asymmetrically with respect to their sign, future market return variations.
[Please read the research paper here]
Strategic alliances are established between firms to improve their competitiveness in markets and generally appear in the form of joint ventures. Such collaborative efforts require centralized planning, and the survival of the alliance largely depends on the success of joint planning processes. In this regard, we investigate the opportunities that centralized collaboration can offer to firms when designing their service networks. Apart from the classical fixed and variable costs associated with the network design, we also consider transaction costs induced by the formation of the alliance, which can broadly be defined as cost components related to the coordination and monitoring of the people, efforts and resources. We concentrate on bilateral alliances and develop alternative models for solving their associated network design problem. We also adopt a state-of-the-art heuristic to solve large-scale instances. Our findings confirm that accounting for the transaction cost in network design is vital for the alliance. These transaction costs can be high enough to even render the collaboration unattractive. Hence, careful data collection and model treatment are required before deciding whether to form an alliance.